 Facebook
 Google
 GitHub
 Linkedin
2022 Renewable Trends: Clean Energy Sectors Face Challenges
As part of our year-end coverage, here is a look back at the challenges faced by cleantech in 2022.
Renewable energy is a fairly dynamic industry, and as trends come and go, new approaches to running America’s supply chains rise to the surface. The many needs and challenges permeating the cleantech ecosystem were detailed earlier in 2022 in a series of “deep dive assessments” by researchers at the U.S. Department of Energy’s National Renewable Energy Laboratory (NREL).

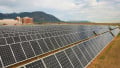
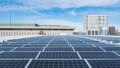
Contractors work on solar panels at the U.S. Department of Energy's National Renewable Energy Laboratory. Image used courtesy of NREL
With 2023 approaching, EE Power will review the key takeaways of those reports in light of the latest developments in the clean energy market’s top subsectors.
This is the first article in a two-part analysis of the NREL’s clean energy assessments. The second will cover semiconductors and water electrolyzers/fuel cells.
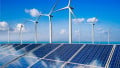
United States Lags in Solar Supply Chain Worldwide
Topping the NREL’s solar photovoltaics report is a projection that the renewable power source could supply at least 40 percent of U.S. electricity demand by 2035. But despite solid expectations, America’s supply chain is weak on the international stage.
China currently dominates the production of key components of solar systems, including 97 percent of the world’s silicon wafers. With no active crystalline silicon ingot, wafer, or cell production in the United States, companies rely on Chinese subsidiaries to supply 75 percent of the silicon solar cells that are made into modules and installed domestically.
Coinciding with high demand and falling prices, the United States added a record 13.2 gigawatts (GW) of utility-scale solar capacity in 2021, according to the U.S. Energy Information Administration. A 25 percent jump from 2020’s 10.6 GW, this growth came despite project delays, supply chain issues, and price volatility. However, that momentum won’t keep up with the underlying supply chain gaps without significant domestic manufacturing incentives.

Graph illustrates U.S. production of photovoltaic components and PV installations. Image used courtesy of DOE’s Solar PV Supply Chain Deep Dive Assessment
The NREL report suggests a few potential solutions. More tax incentives for domestic manufacturing are necessary for companies that produce and sell solar components, which require financial support to offset the 30 to 40 percent cost increase that comes with domestic solar production. Secondly, the report mentioned the need to extend clean energy deployment credits—namely the Production Tax Credit (PTC) and Investment Tax Credit (ITC)—for at least 10 years until the U.S. supply chain has caught up with the global competition.
Some of those ingredients are already in motion to incentivize further solar development. The Inflation Reduction Act (a $739 billion package signed in August 2022) earmarks $369 billion for renewable energy and electric transportation programs, including some $60 billion for on-shore clean energy manufacturing via PTCs for solar panels, wind turbines, batteries, and other materials. It also adds another ITC to support facilities producing electric vehicles (EVs), wind turbines, and solar panels.
According to the Solar Energy Industries Association’s Q3 2022 U.S. Market Insight report, the Inflation Reduction Act is expected to propel the U.S. solar market by 40 percent over baseline projections through 2027, corresponding to 62 GW of additional solar capacity.
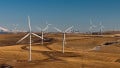
Offshore Wind Power Gradually Gains Momentum
In their assessment, NREL researchers project that wind power could account for 35 percent or more of U.S. electricity demand. In 2021, wind turbines claimed 9.2 percent of all utility-scale electricity generation nationally, but more than a dozen states sourced more than 10 percent of their electricity from wind.
Land-based wind development aside, offshore wind is still nascent in the United States, with only 42 megawatts (MW) operating across two sites. However, the project pipeline grew by about 14 percent in 2021 to 40 GW of generating capacity in development. Besides the two projects already in operation at 42 MW, another pair are under construction with 932 MW, and 18 projects totaling 18 GW are in the permitting process.
The Bureau of Ocean Energy Management auctioned several new offshore lease areas along the Atlantic coast in 2022, and it plans to ramp up its activities in the Pacific and the Gulf of Mexico.
Still, the wind report identifies several critical vulnerabilities. These range from rare earth magnet shortages and commodity price risks to demand uncertainty and gaps in near-term wind energy projects and domestic manufacturing capacity. Vulnerabilities persist despite wind installations reaching their second-highest level in 2021, adding 13.4 GW of new capacity.

Bar graph shows the growth in U.S. wind energy capacity. Image used courtesy of the U.S. Department of Energy
Another challenge is strained logistics networks for land-based turbine materials due to the growing size of components. Offshore wind component logistics are even further complicated by the lack of ports, vessels, and other infrastructure. But some states, including California and New York, have started renovating ports to make way for offshore deployment.
The report highlights several other barriers, including the lack of wind-specific workforce training/development and the need for alternatives to rare earth permanent magnet generators, such as superconducting systems. The United States also needs to increase its manufacturing capacity of components not currently produced domestically, including large iron and steel castings and forgings, and blade manufacturing.

A graph of the United States’ domestic wind manufacturing capabilities vs. capacity installations. Image used courtesy of DOE’s Wind Energy Supply Chain Deep Dive Assessment
Grid Energy Storage
The NREL’s grid energy storage report covers the two primary technologies driving the sector today: Short-duration (batteries that regulate frequency and store energy for less than 10 hours) and long-duration (providing load shifting over days, mainly through pumped storage hydropower).
As with many other industrial markets, the domestic supply chain for energy storage components is largely dependent on China for raw and processed materials, lithium-ion (li-ion) batteries and their components, and even end-of-life recycling (with most used batteries currently being exported). The United States has little to no mining sources for the li-ion battery materials needed for short-term energy storage, such as nickel, iron, and graphite. China produces about two-thirds of the world’s cobalt and lithium, along with 95 percent of refined manganese materials.
Though the United States has increased its li-ion cell manufacturing capacity to a global share of 13 percent, China still keeps the lead with nearly 80 percent and numerous facilities planned or under construction.

This diagram shows the complex nature of the lithium-ion battery supply chain. Image used courtesy of DOE’s Grid Energy Storage Supply Chain Deep Dive Assessment
Besides needing to increase the capacity for energy storage components and raw and refined materials, the report draws attention to a few other factors limiting the energy storage market. Since Li-ion batteries share an end market in the transportation sector, the growth of EVs will mean grid storage competes with a much larger industry.
The report encourages the development of viable battery alternatives with different chemistries and more standardization for energy storage applications. Other promising technologies worthy of further development include flow batteries, compressed air energy storage, and thermal energy storage.
Zooming out a bit: Despite supply-level challenges, grid storage deployment is projected to increase from an average of 1.6 to 11 gigawatt-hours (GWh) per year in the current decade to 40 to 250 GWh deployed annually in the 2040s.


Interested in <a >contractor classes online Giorgia</a>? Here’s a detailed guide to get you started.