 Facebook
 Google
 GitHub
 Linkedin
Magnetic Losses Under Control—Beyond Inductance Measurement
Core losses are a decisive determinant of the thermal behavior and long-term reliability of inductive components. They set the operating temperature rise of chokes and transformers, influence efficiency, and are a frequent root cause of premature aging and field returns. With the help of the revolutionary Loss-Q-Check feature in the 4th software generation of ed-k’s Power Choke Tester DPG10/20 series, it is possible to quickly and easily determine during serial production whether core losses are higher than normal.
This article is published by EEPower as part of an exclusive digital content partnership with Bodo’s Power Systems.
Article is co-authored by ed-k's Hubert Kreis.
Two identical components may feature the same core type and the same measured inductance yet exhibit vastly different core losses. This can result in one component performing reliably for decades while the other fails prematurely in the field. For manufacturers, the practical question is blunt: will the cores I receive and the wound components I ship behave thermally as expected in the field?
The reason for this is that identical cores from different manufacturers – or even different production batches – can have significantly different core loss characteristics, despite what the data sheet might suggest. Consequently, measuring inductance alone is insufficient. To ensure a component does not exhibit excessive core losses, the losses themselves must be tested. Thanks to the widely used Power Choke Tester DPG10/DPG20 series and the revolutionary Loss-Q-Check software add-on, this testing can now be performed quickly and easily during serial production.
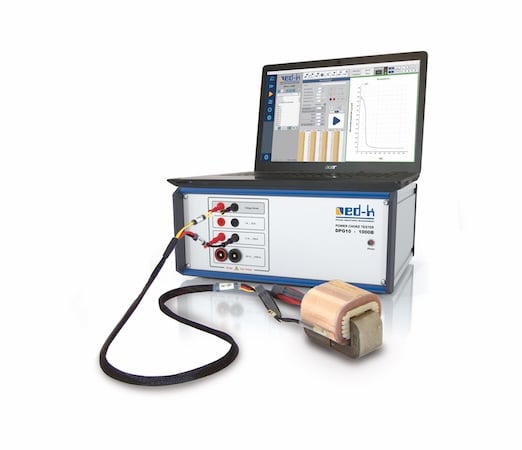
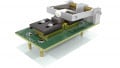
Figure 1. DPG10/DPG20 test setup used for production magnetization measurements; rugged hardware and simple wiring enable repeatable shop floor tests. Image used courtesy of Bodo’s Power Systems [PDF]
Existing Power Loss Measurement Methods Are Not a Solution for Serial Production
Accredited loss measurements that follow standards such as IEC 62044-3 rely on laboratory power analyzers and phase-shift techniques. Those systems are precise but expensive and operationally demanding – typically costing €50k – €150k and requiring controlled fixtures, careful calibration, and specialist personnel. In short: sophisticated test rigs demand sophisticated engineers to operate them and to interpret results. That reality has forced many component makers to accept vendor datasheet values and perform only limited verification at incoming inspection or final test.
Conventional loss measurements become less precise at low loss levels due to phase errors.
ed-k’s Loss-Q-Check (LQC) reframes the problem. Rather than attempting to reproduce a laboratory power-loss measurement on the shop floor, LQC evaluates how the entire magnetization curve of a particular sample deviates from the reference for that material grade and converts that whole-curve deviation into a single, auditable percentage deviation. That percentage drives a clear traffic-light decision and is accompanied by diagnostic evidence that accelerates supplier feedback and corrective action.
The software add-on runs on the rugged Power Choke Tester DPG10/DPG20 platform already common in production environments, requires minimal operator training, and is designed to be production-near: fast, repeatable, and operationally actionable by basically trained technicians rather than only by laboratory engineers.
This article explains the physical basis of whole-curve inference, clarifies why a magnetization-based approach reliably indicates loss behavior without relying on phase-shift measurement, deepens the rationale and flexibility of the traffic-light decision framework, and highlights why Loss-Q-Check is a genuinely disruptive and highly useful capability for manufacturers.
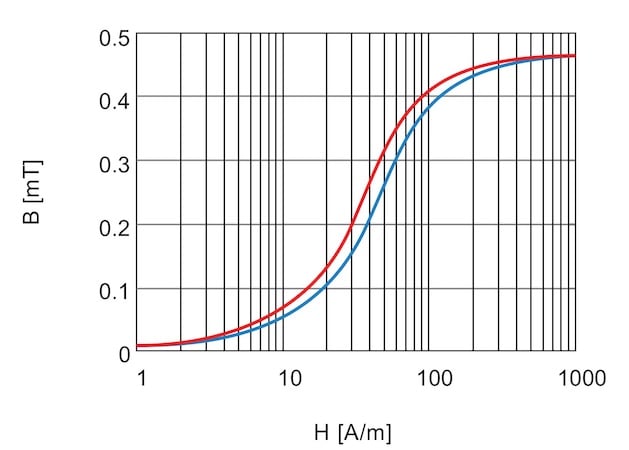
Figure 2. Magnetization characteristics for a reference material (blue) and a material exhibiting increased irreversibility and modified curvature (red). Although both materials retain the same nominal saturation level and low-field permeability, measurable deviations appear throughout the transition region of the B(H) characteristic. Such deviations reflect changes in the underlying magnetic material parameters that are also responsible for hysteresis losses, forming the basis of the Loss-Q-Check methodology. Image used courtesy of Bodo’s Power Systems [PDF]
Principle – Wholecurve Deviation, Irreversibility and Fundamental Parameters
The physical foundation of LQC is straightforward: the energy dissipated in a magnetic cycle equals the area enclosed by the B–H hysteresis loop. That loop area is determined by the balance of reversible and irreversible magnetization processes. Irreversible mechanisms – domain-wall pinning, microstructural defects, residual stress, contamination, or improper processing – change the loop geometry across the full field range. Those global changes in loop shape are the signature of altered energy dissipation per cycle.
A compact set of fundamental parameters governs the magnetization curve and the associated losses:
- Initial permeability
- Saturation
- Coercive characteristics
- Loop curvature
- A reversibility parameter that quantifies the degree of reversibility of magnetization
The reversibility parameter captures how much of the magnetization process is recoverable versus dissipative and therefore how much energy is lost per cycle. LQC evaluates deviations in these parameters from the reference and reports a single percentage deviation together with a diagnostic summary of which parameters moved and in what direction.
\[W=\oint H dB\]
\[p=f\cdot W\]
\[\Delta\%\approx\frac{W_{sample}-W_{ref}}{W_{ref}}\times100\%\]
These expressions show that loop area is the fundamental quantity and that a change in loop area maps directly to a change in cycle energy and therefore to power loss at a given frequency. LQC’s percentage deviation is derived from a whole-curve comparison and is therefore working-point independent: it answers the practical question “how different is this core from the reference?” rather than producing a loss number at a single arbitrarily chosen operating condition
Why Whole-Curve Assessment Matters
Many manufacturing faults and downstream stresses produce signatures that are visible across the magnetization curve: increased coercivity, reduced initial permeability, altered curvature near saturation, or poorer loop closure. A whole-curve comparison is therefore more likely to detect meaningful deviations than a single working-point measurement.
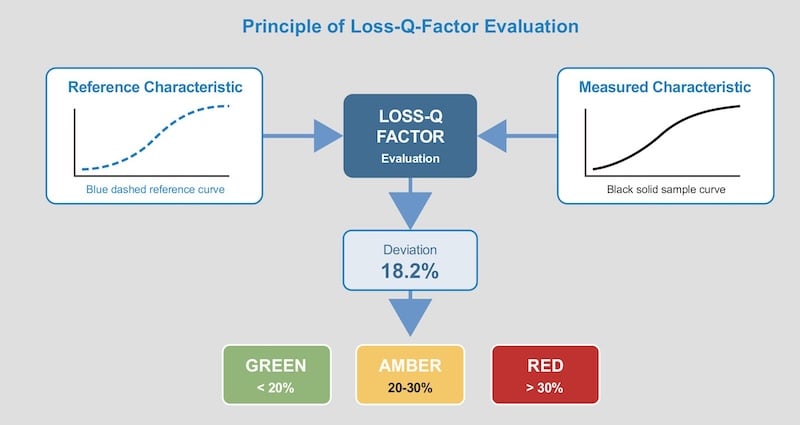
Figure 3. Principle of Loss-Q-Check evaluation. The measured magnetization characteristic (black solid curve) is compared with the reference characteristic associated with the selected material grade (blue dashed curve). Deviations are evaluated on the basis of the underlying magnetic material behavior and expressed as a percentage quality indicator. The resulting deviation is translated into a configurable Green Amber Red (RAG) classification suitable for incoming inspection, supplier qualification, and end-of-line quality control. Image used courtesy of Bodo’s Power Systems [PDF]
Why LQC Works Without Direct Phase-Shift Measurement
Phase-shift measurement is a well-established laboratory proxy for dissipated power, but it is a circuit-level technique that depends on fixture geometry, parasitics, and careful calibration. In production environments, those variables are often uncontrolled and can mask material changes. LQC evaluates the material response directly from the magnetization curve, without phase-shift measurement.
By reconstructing the magnetization curve under controlled excitation and converting that curve deviation into a percentage, LQC accesses the fundamental quantity (loop area) rather than a circuit proxy.
- It is less sensitive to fixture parasitics. Because the method focuses on the B–H behavior, it reduces sensitivity to winding geometry and parasitic impedances that complicate phase-shift methods in production.
- It provides diagnostic richness. Whole-curve deviations are decomposed into parameter shifts (permeability, coercivity, reversibility, curvature), which point to likely physical causes and guide supplier investigations — something a single phase-shift number cannot do.
- It is production-robust. The DPG10/DPG20 hardware is engineered for repeatable magnetization capture in factory conditions; LQC translates that repeatable response into a robust, auditable metric.
ed-k validated LQC by comparing whole-curve percentage deviations to laboratory power-analyzer results across representative materials and geometries. While LQC is not a metrological replacement for accredited laboratory measurements, the validation shows that whole-curve deviations reliably track the material changes that matter for thermal performance and therefore provide a robust basis for production decisions.
Traffic-Light System (RAG) – Flexible, Auditable, Production-Near
The RAG traffic-light system is the operational heart of LQC. Its purpose is to convert whole-curve diagnostics into clear, auditable, and defensible actions that fit existing quality workflows on the shop floor. It is based on the following design principles.
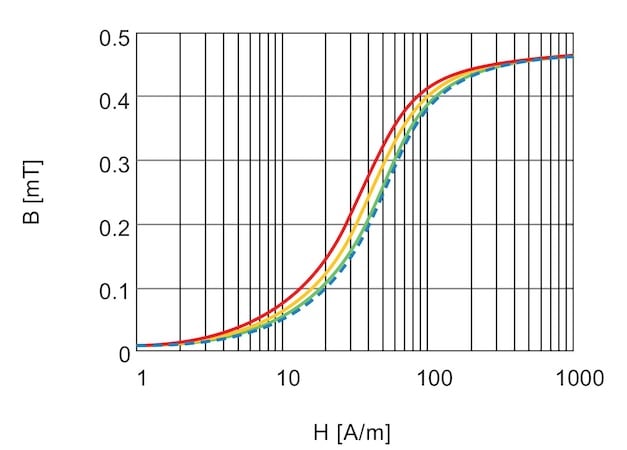
Figure 4. Representative Loss-Q-Check classifications derived from deviations of the measured magnetization characteristic. The blue dashed curve denotes the reference characteristic associated with the selected material grade. The green solid curve represents a sample with a small deviation from the reference and is classified as Green. The amber solid curve represents a moderate deviation (Amber), while the red solid curve represents a significant deviation (Red). The increasing separation from the reference characteristic reflects increasing changes in the underlying magnetic material parameters and therefore increasing deviation in loss-related behavior. Default threshold values are shown for illustration and may be adjusted by the user. Image used courtesy of Bodo’s Power Systems [PDF]
- Actionability: Each color corresponds to a predefined set of operator, engineering, and supplier actions.
- Robustness: Thresholds detect deviations that matter for thermal performance while minimizing false positives.
- Traceability: Every RAG decision is logged with the full evidence package: raw magnetization curve, parameter deviations, device and operator metadata, and a short diagnostic note.
- Adaptability: Default thresholds are provided as a factory start point but can be adjusted by the user to match product-specific thermal margins, reliability targets, or regulatory requirements.
Default thresholds and rationale:
- Green — Accept (deviation < 20%): Small deviations within expected manufacturing tolerances.
- Amber — Hold for review (deviation 20–30%): Meaningful deviations that warrant increased sampling and engineering review.
- Red — Quarantine (deviation > 30%): Deviations likely to cause thermal or reliability issues; require quarantine and supplier escalation.
User Configurability and Operational Rules
Users can tailor RAG thresholds and define contextual escalation rules (for example, automatic supplier notification after two consecutive amber lots). Operational rules include immediate repeat tests to confirm reproducibility, pattern recognition across multiple samples before supplier escalation, and contextual relaxation for non-critical product lines while maintaining strict rules for safety-critical applications.
Every RAG decision is accompanied by an evidence package that makes the decision auditable and defensible and accelerates laboratory follow-up and supplier corrective action.
Functionality, Workflow and Practical Constraints
LQC is delivered as a software module for the DPG10/DPG20 platform and is designed for rapid deployment in production environments. The user experience is intentionally simple so that basically trained technicians can run meaningful tests without the need for laboratory engineers.
Key workflow:
1. Material selection: Operator selects vendor and material grade; the reference curve is taken from the material baseline associated with that grade.
2. Geometry and winding input: Operator enters core geometry and number of turns; the software converts measured signals into a magnetization trace.
3. Automated magnetization test: The DPG10/DPG20 device runs a controlled excitation optimized for repeatability in production and captures the magnetization response.
4. Whole-curve comparison and percentage deviation: The software compares the sample curve to the reference and computes the percentage deviation that drives the RAG decision. The output includes a diagnostic summary of which fundamental parameters shifted and by how much.
5. RAG decision and evidence logging: The result is displayed with color, diagnostic notes, and an evidence package that is stored and exportable for SPC and supplier reporting.
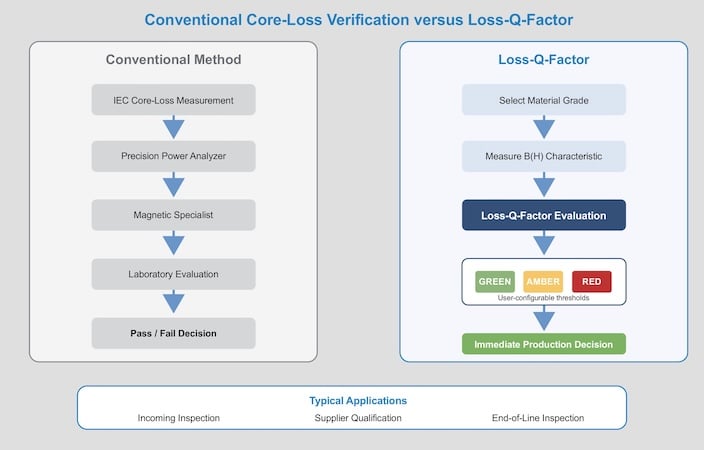
Figure 5. Comparison between conventional laboratory-based core-loss verification and the Loss-Q-Check workflow. Traditional loss measurements involve dedicated instrumentation, controlled laboratory conditions, and expert interpretation of the results. Loss-Q-Check enables a production-oriented assessment by comparing the measured magnetization characteristic with the reference characteristic of the selected material grade. The resulting Green Amber Red (RAG) classification supports incoming inspection, supplier qualification, and end-of-line quality control using standard DPG10/20 equipment and routine operator training. Image used courtesy of Bodo’s Power Systems [PDF]
Practical constraints and caveats:
- Suitable core materials: The LQC software is available for the following core materials: powder cores, ferrite cores, nanocrystalline cores, and amorphous cores. It is not suitable for laminated core materials.
- Room-temperature testing: LQC tests are performed at room temperature as a standard production procedure. For materials whose losses are strongly temperature-dependent (notably some ferrites at elevated temperatures), the room-temperature LQC result is a production-grade screening indicator. If a product’s operating environment includes elevated temperatures where ferrite loss changes significantly, laboratory verification at the relevant temperature remains necessary.
- Input correctness: Accurate geometry and correct material grade selection are necessary for reliable comparisons. The software includes guided prompts and default baselines to reduce operator error.
- Not a metrological replacement: For certification, regulatory, or research needs requiring metrological accuracy, laboratory power-loss measurements remain the reference standard.
Examples – Wholecurve Deviation in Action (Illustrative)
The examples below are mere examples to highlight functionality; they are not exhaustive test cases.
Example – soft magnetic composite (incoming inspection).
- Outcome: Whole-curve comparison yields +12% deviation relative to the reference curve ➝ Green
- Diagnostic summary: Slight broadening of the low-field region consistent with a modest increase in irreversible pinning; saturation behavior unchanged.
- Action: Accept and release to assembly; evidence logged for SPC.
Example – power ferrite (post-sintering lot).
- Outcome: Whole-curve comparison yields +35% deviation ➝ Red
- Diagnostic summary: Global reduction in low-field slope (initial permeability) and increased loop curvature across the mid-field region; pattern consistent with sintering anomalies.
- Action: Quarantine lot; send representative samples to laboratory for metrological separation of loss components and supplier root cause analysis; provide supplier with full magnetization traces and parameter summaries.
Example – Aged amorphous alloy core (condition assessment).
Context: Evaluation of an amorphous alloy core that had been in service for more than 20 years.
• Outcome: Whole-curve comparison yielded a deviation corresponding to an estimated 70% increase in core losses relative to the original material specification.
• Diagnostic summary: Significant deviations were observed in the magnetization characteristic despite the absence of visible mechanical damage. The behavior is consistent with long-term structural relaxation and partial crystallization effects that are known to degrade the soft magnetic properties of amorphous alloys and increase losses.
• Action: Classified as Red. The example demonstrates how LossQ-Check can identify loss-relevant aging effects directly from changes in the magnetization characteristic, making it suitable not only for incoming and end-of-line inspection, but also for condition assessment of long-life magnetic components.
These scenarios show how a single, working-point-independent percentage deviation becomes a practical decision metric while preserving diagnostic richness for engineering follow-up.
Validation, Adoption and Business Impact
ed-k validated LQC against laboratory power analyzers across representative materials and geometries. The whole-curve percentage deviation reliably tracked laboratory-measured loss changes that mattered for thermal performance. The validation supports LQC’s role as a production-grade screening and diagnostic tool.
Adoption roadmap:
1. Pilot: Validate LQC on representative cores and wound components and compare to laboratory measurements.
2. Tune: Adjust RAG thresholds to match product thermal margins and reliability targets.
3. Integrate: Connect results to MES and SPC for real-time trending and supplier scorecards.
4. Scale: Deploy across lines and sites to create a consistent, data-driven supplier management program.
Business impact:
- Fewer field failures: Early detection of out-of-spec cores reduces thermal failures.
- Lower warranty costs: Objective screening reduces returns and rework.
- Faster supplier corrective action: Evidence packages focus investigations and shorten resolution time.
- Operational efficiency: Production-near testing reduces capital and personnel burden compared with lab rigs.
Conclusion
Loss-Q-Check reframes shop-floor loss verification by focusing on the whole magnetization curve and converting full-curve deviations into a single, auditable percentage deviation. By measuring magnetization-curve deviations, it avoids phase-resolution challenges at very low loss levels. The metric pertains to fundamental parameters that drive both the magnetization curve and core loss – including a parameter that quantifies the degree of reversibility – and it is sensitive to deviations caused by core manufacturing fluctuations as well as stresses introduced during component manufacture. The traffic-light decision framework is configurable to user needs and is accompanied by evidence packages that make decisions defensible and supplier interactions efficient.
Loss-Q-Check is not a substitute for accredited laboratory metrology where that is required – particularly for temperature-dependent ferrite behavior at elevated operating temperatures – but it fills a critical and previously unmet gap: affordable, repeatable, and actionable loss verification at the point where cores are received, or components are finished, usable by production technicians rather than only by laboratory engineers. For manufacturers seeking to move from vendor trust to data-driven assurance, Loss-Q-Check offers a genuinely innovative, disruptive, and highly useful capability that reduces field surprises, shortens supplier feedback loops, and turns magnetics quality into a measurable, auditable asset.
Loss-Q-Check will be available as a subscription add-on for DPG10/ DPG20 devices running software version 4.x or later.
This article originally appeared in Bodo’s Power Systems [PDF] magazine and is co-authored by Mauricio Esguerra, Magnetics Expert, and Hubert Kreis, Chief Executive Officer, ed-k