Facebook
 Google
 GitHub
 Linkedin
How Preserved Echoes Diagnose Component Failures
This article highlights SONOSCAN Acoustic micro imaging (AMI) tools that can nondestructively image internal structural anomalies such as cracks or delaminations.
The failure may involve a military system, medical equipment, or any other application where sudden shutdown is undesirable and serious. A subsystem fails electrically, and the immediate cause is pinpointed as the unexpected failure of a single component. This component, and the unit it is installed in, both have good track records, so there is interest in learning the precise cause of the failure, since it seems possible that the present failure might involve some type of internal structural failure within the component.
Acoustic micro imaging (AMI) tools can nondestructively image internal structural anomalies such as cracks or delaminations, but in some cases the component is not available for imaging to determine the cause of the failure. The component may be irretrievable because it is traveling in space, or if earthbound it may have been entirely destroyed by the failure.
In such cases the outlook will be brighter if precautions have been taken against such an event. Before a component is mounted onto its board, all echoes from the entire volume of the component can be collected and preserved by the Virtual Rescanning Mode™ (VRM), one of the imaging modes in the C-SAM® line of acoustic micro imaging tools from Nordson SONOSCAN.
These tools pulse ultrasound into a sample and collect the return echoes, which are produced only by material interfaces. A pulse sailing through featureless silicon or mold compound sends back no echoes, but when it strikes the interface between the current material and another material, it sends back to the transducer that launched the pulse an echo containing information about the two materials that meet at the interface. Before they are mounted on boards, loose components may be mass screened by an automated acoustic micro imaging tool to prevent components having structural defects from being used in assembly and causing eventual field failures. The tool typically images a specific depth of interest - the bonding of the solder bumps to a die face in a flip chip, for example. Gating means that only echoes from the selected depth are used to make the acoustic image, and to classify the component as accept/reject. Routine automated inspection for structural defects may therefore look at only part of the thickness of a sample, and in that gate it will use techniques for finding the most common or most critical structural defects.
VRM vastly supplements this process by scanning and collecting all of the raw echoes received from all depths at each of the thousands of x-y locations where a pulse is launched into the sample. This method collects echoes returned from the entire volume of the component. The result is a large amount of data - amplitude, polarity, arrival time and frequency - that can be analyzed as desired. (Standard C-mode imaging, by contrast, selects at each x-y location only the amplitude of a single echo. The user cannot later recapture the additional values from the amplitude data.)
The VRM echoes are preserved in a ‘matrix’ file. Because echoes are generated only at material interfaces, most of the volume of the component will produce no echoes because it consists of homogeneous material such as silicon. But VRM generates and records all of the echoes from all of the material interfaces in the entire x-y-z volume of the component - far more than is collected by standard mass acoustic inspection.
When a component that has been archived by VRM fails in service, the matrix file of echoes is retrieved and scanned as though it were the physical component in order to gain insight into what may have caused the failure. Matrix file scanning is typically more comprehensive than the original mass scan: it contains all echoes, and not just the echoes from a depth where failures most often occur. What VRM is looking for is an anomaly, possibly quite small. The anomaly may, for example, have been buried in a larger echo and thus not have been detected earlier. VRM scanning may involve all depths within the component, and may use any of the 15 or so C-SAM imaging modes. The anomaly that caused the field failure may be identified, imaged and analyzed, for example, by using the non-destructive cross-sectioning mode, the three-dimensional mode, the thin slice mode, or any other mode.

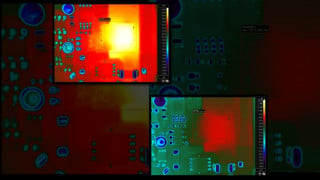
Figure 1: The appearance of a tiny corner of this IGBT’s raft - barely within the gate being imaged - indicates that the raft is tilted rather than flat.
Figure 1 is the acoustic image constructed from the VRM matrix file of an IGBT module. The die of an IGBT can be damaged by contamination left by evaporating water. High voltage current may traverse contaminated areas and cause the IGBT to fail. IGBT modules are therefore typically imaged from the bottom side by using an inverted imaging tool to pulse ultrasound through the heat sink and collect the return echoes. In this way the die is kept away from the coupling fluid.
It was thought that the eventual failure of the IGBT module may have been related to voids in the solder bonding the heat sink to the ceramic raft, so gating encompassed almost the entire calculated depth of solder, while avoiding the heat sink above the solder and the ceramic raft below the solder. Figure 1 displays about 3% of the area of one die. Because the solder itself is homogeneous, it returns no echoes, and the ideal image in this situation would be featureless and solid gray, meaning “no return echoes received.” In Figure 1 there are a few tiny features which are probably tiny voids at varying depths within the solder.
Near the lower left corner, however, is a pale gray feature much larger than the voids. The pale gray feature is a corner of the tilted raft that moved into the gate. Its brighter hue indicates that it is the interface between two solid materials - the solder and one corner of the ceramic raft. But the gate from which echoes were used for making this image was at a depth that should encompass only the solder layer. Deeper imaging revealed that the ceramic raft was irregularly distorted, and this corner of the raft was the highest point (when viewed through the heat sink) and the only part of the raft imaged within the whole area of the gate used to make Figure 1.
The module may have failed because the uneven thickness of the solder resulted in a temperature gradient that put mechanical stress on the raft. In conducting the post mortem on the module from the matrix file, the small corner of the raft in Figure 1 was the first clue.

Figure 2: A very narrow (vertically) gate was used to reveal die tilting inside this plastic BGA package.
A BGA that had failed in service is shown in the VRM image in Figure 2. When the usual C-mode imaging was used on the matrix file and had not identified any pre-existing condition that could have led to an electrical failure, the same mode was used but with a much narrower (vertically) gate to accept only echoes reflected from a sequence of thin “slices” of the BGA package.
In this thin slice, one can see that the die is not flat. The lower right corner of the die is tilted downward and lies below the gate; the upper left corner is above the gate. The black features on the die are the acoustic shadows of voids in the underfill above the gate.
The tilt would put some degree of stress on wire bonds. Given time and thermal cycling, one or more wires may have broken to cause the failure that generated the need to examine the component's matrix file. In planar imaging, as used during pre-mounting inspection, a thicker gate would have been used, with the result that all of the die would have the same color and would therefore appear to be horizontal.

Figure 3: Variations in the brightness of the bumps indicate some disbonds in this flip chip.
The image in Figure 3 was produced from the matrix file of a flip chip, and was imaged through the die at a frequency of 230 MHz to achieve high resolution. The images are gated on the depth of interest: the bonding of the solder bumps to the die.
The bumps themselves range from bright to dark, bright suggesting some degree of disbond from the die because there is an air gap reflecting nearly all of the arriving ultrasound. Surrounding each bump are four copper pads, whose shades also range from bright to dark, and for the same reason.
In each of the absent devices described here, VRM was able to extract from the preserved matrix file an anomaly that might have caused the component to fail electronically. The data in the three images does not conclusively prove that these were the existing internal anomalies that led to failure. But if VRM investigation reveals no other candidates matching the manner and extent of failure that occurred, these are very good candidates. It should be mentioned that recent advances in automated acoustic scanning may find an anomaly that otherwise might be found only after it has caused a failure. Thin-slice imaging, for example, can now be performed by automated tools. If the tilted die in Figure 2 had been imaged in this manner, it might never have become a field failure.
About the Author
Tom Adams is a consultant for Sonoscan, Inc., one of the most trusted authority on the application of Acoustic Micro Imaging (AMI) technology for nondestructive inspection and analysis. They are dedicated to technological innovation, and devotion to the highest quality results, and the ongoing training and development.