Facebook
 Google
 GitHub
 Linkedin
Distribution System Fundamentals—Part 1: Networks
This overview develops distribution’s role within the power system hierarchy, its functional objectives and constraints, and the common voltage levels and structural elements in distribution design and operation.
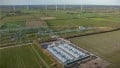
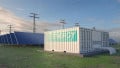
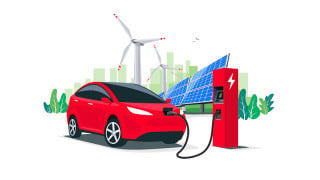
Electric power systems rely on distribution networks to translate bulk energy into safe, usable service at facilities and premises. This layer sits closest to end-use demand, spans the largest share of total grid mileage, and must balance technical constraints with economic realities while accommodating evolving resources, such as distributed energy resources (DERs) like photovoltaics, storage, and electric vehicles.
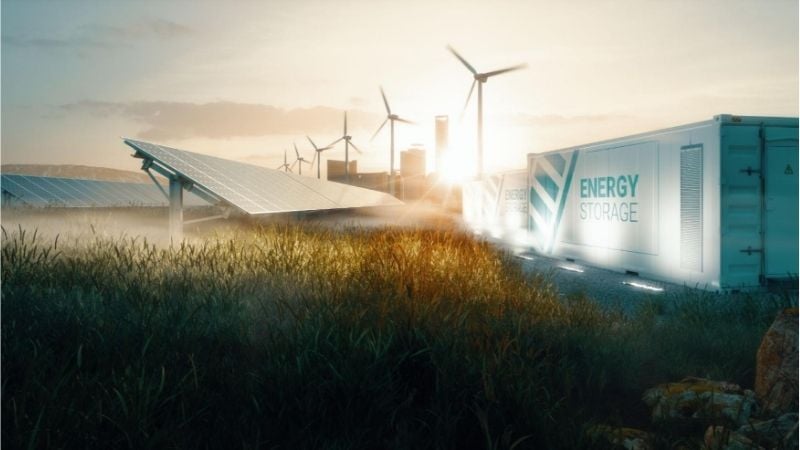
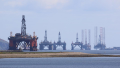
Renewable energy system. Image used courtesy of Adobe Stock
Role of Distribution in the Power System Hierarchy
Position Within the Power Value Chain
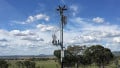
From an energy-delivery standpoint, the sequence is Generation → Transmission → Subtransmission → Distribution → Utilization.
Transmission moves bulk power at very high voltages to minimize losses and conductor size; subtransmission bridges to regional load centers; and distribution reduces voltages further and provides the last-mile connectivity to customer equipment.
Voltage reduction stages and trade-offs: Each step-down reduces the required insulation level and equipment clearances at the downstream voltage level and increases current for a given power transfer but introduces additional transformers and protection elements that add losses and cost.
Utilities therefore standardize on a small set of well-supported primary and secondary voltage classes to balance conductor cost, losses, clearances, and equipment availability, as formalized internationally in IEC 60038 for both low- and medium‑voltage bands.
Why distribution is the most asset‑intensive layer: Globally, about 93% of total grid line length resides at distribution voltages, compared with roughly 7% at transmission. That vast footprint—poles, padmounts, reclosers, fuses, secondary lines, and meters—explains both the capital intensity and the operational exposure of this layer.
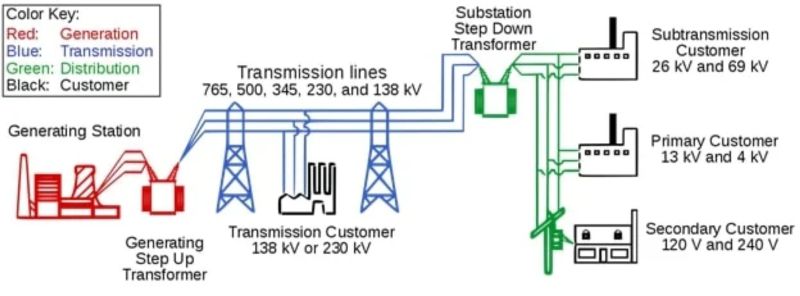
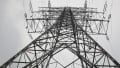
Figure 1. Power generation, transmission, sub-transmission, and distribution. Image used courtesy of EEPower
Functional Objectives of Distribution Networks
Deliver acceptable voltage at the point of common coupling (PCC): Low‑voltage nominals, such as 400/230 V at 50 Hz (IEC regions) and 208Y/120 V or 480Y/277 V at 60 Hz (North America), are codified in standards to ensure utilization equipment receives voltage within specified tolerances.
Maintain reliability and continuity of supply: Reliability indices, such as SAIDI (System Average Interruption Duration Index) and SAIFI (System Average Interruption Frequency Index), are used to track performance. Many interruptions originate in distribution circuits due to weather, vegetation, and equipment. Public data show trees, storms, wildlife, and equipment failures among the leading outage causes for power utilities.
Provide protection selectivity at lower fault levels: Distribution feeders have historically operated radially with overcurrent‑based protection grading from lateral fuses toward feeder breakers. DER interconnections can alter fault current directions and magnitudes, challenging selectivity and sometimes requiring directional elements or adaptive settings.
Enable distributed energy resource (DER) interconnection: IEEE Std 1547‑2018 specifies performance, interoperability, and voltage/reactive power capabilities for DERs at distribution voltages, forming the technical basis for modern interconnections and smart‑inverter functions.
Engineering Constraints Unique to Distribution
Lower short‑circuit levels than transmission: Source impedance, longer feeders, and higher R/X ratios yield lower available fault currents on many feeders compared with transmission buses. Traditional overcurrent coordination is practical in radial topologies, but DER additions can alter fault flow and complicate coordination.
High R/X ratios and voltage regulation: Distribution lines are relatively resistive compared to transmission. As a result, changes in active power strongly influence voltage magnitude, and reactive compensation can have non‑intuitive effects on feeders with high R/X ratios. For instance, shunt capacitors can worsen voltage at some locations if misapplied.
Load diversity and daily demand variability: Aggregated load profiles benefit from diversity. Not all connected loads peak simultaneously. This principle, formalized as the diversity factor, informs transformer and feeder sizing and helps avoid unnecessary capacity.
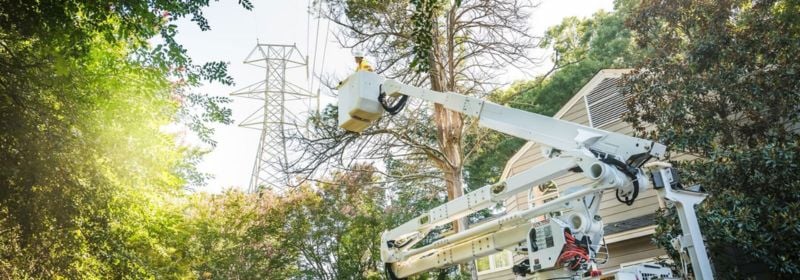
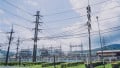
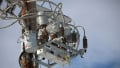
Figure 2. Vegetation management. Image used courtesy of Duke Energy
Exposure to environmental disturbances: Most weather‑driven and vegetation‑related events occur at distribution voltages. Utilities report that a large share of sustained interruptions is caused by trees, storms, and wildlife, with summer months often seeing the highest outage counts.
Voltage Levels and Structure of Distribution Systems
Primary Distribution Levels
Primary (medium‑voltage) distribution typically operates between about 5 and 35 kV. Two widely used series are defined in IEC 60038: 10/20/30/35 kV and 11/22/33 kV. In North America, common classes include 4.16, 12.47, 13.2,13.8, 14.4, 23.9, and 34.5 kV.
Substation transformers step down from transmission or subtransmission to these levels. Examples include 132/33 kV, 66/11 kV, or 69/13.8 kV arrangements. Equipment ratings, allowable voltage variation, thermal ampacity, and protection coordination limits set feeder capacity.
Typical urban and suburban substations dispatch multiple feeders. Each is designed for both normal and contingency loading, accounting for conductor ampacity and voltage drop. Utilities may also specify maximum outgoing feeder counts and substation transformer ratings to standardize layouts and maintenance practices.
Secondary Distribution Levels
Secondary or utilization voltages follow standardized nominal sets:
IEC regions: 230/400 V (phase‑to‑neutral/phase‑to‑phase) at 50 Hz is the prevailing three‑phase LV standard, with 400/690 V used for certain industrial installations.
North America: Wye secondaries at 208 Y/120 V or 480 Y/277 V serve commercial/industrial loads; residential service commonly uses 120/240 V split‑phase from a single‑phase distribution transformer.
The choice between three‑phase and single‑phase delivery depends on load magnitude and type. Commercial sites with significant motor or HVAC demand often require three‑phase. Detached residences typically receive single‑phase or split‑phase service for diversity and cost reasons.
Transformer Placement Strategy
Pole‑mounted and pad‑mounted transformers serve different contexts:
Pole‑mounted: Standard for overhead networks and lower‑density corridors; typically single‑phase units feeding a few premises, protected by fuse cutouts and arresters.
Pad‑mounted: Standard for underground or mixed urban networks; single‑ or three‑phase in locked enclosures on concrete pads, enabling compact siting without fenced yards.
Placement density tracks load density. In urban designs, MV/LV substations with 1,000‑kVA class transformers may be spaced roughly 500-600 m to keep LV feeders short and losses/voltage drop low. In rural networks, larger spacings and overhead secondaries reduce capital cost at the expense of higher voltage drop sensitivity.
A practical planning trade-off emerges between voltage drop and transformer sizing. Closer spacing (or more numerous, smaller transformers) reduces LV voltage drop and conductor size but raises transformer count and no‑load losses. Conversely, fewer/larger transformers increase the average LV feeder length, which raises voltage drop and often requires larger secondary conductor sizes and tighter MV voltage regulation. These trade-offs are often explored using time-series power flow and cost models.
Table 1. Typical considerations guiding primary/secondary choices
| Design Driver | Primary (MV) Implication | Secondary Implication |
| Distance from substation | Higher MV voltage to limit current and conductor size | Longer LV runs raise drop and losses |
| Load magnitude, phase balance | Three-phase feeders and banks | Single- vs three-phase service selection |
| Space | Underground cables, pad-mounts | Compact LV switchboards |
| Fault levels, protection | Device interrupting ratings, grading | Fuse links, breaker trip curves |
| DER hosting | Voltage control devices, smart inverters | Neutral/grounding, backfeed detection |
Voltage Drop Considerations
Voltage regulation is a defining constraint for feeders and secondaries. In steady state, the commonly used line‑drop formulation expresses the incremental drop as a function of current I, conductor resistance R, reactance X, length L, and load power factor angle φ.
Single‑phase or phase‑neutral: $$\Delta U = 2IL~\times~(R\cos\phi~+~X\sin\phi)$$
Balanced three‑phase: $$\Delta U = \sqrt{3}IL~\times~(R\cos\phi~+~X\sin\phi) $$
Impact of power factor: Because distribution circuits are relatively resistive, the R cosφ term often dominates, so lower power factors (larger φ) can increase the reactive component X sinφ and aggravate a drop in some segments.
Smart-inverter Volt/VAr or Volt-PF controls can support local voltages dynamically by adjusting reactive power output, reducing reliance on mechanical tap changers, line regulators, or capacitor switching.
Table 2. Qualitative differences affecting voltage drop
| Feeder Configuration | Typical Attributes | Voltage-Drop Posture |
| Long rural overhead | High R/X, long spans, lateral exposure | Large drop; sensitive to load and PF; often needs mid-feeder regulation |
| Urban underground | Short runs, pad-mounts, network/loop options | Lower drop; higher short-circuit levels; tighter voltage bands |
| Mixed suburban | Overhead/UG mix, moderate lengths | Intermediate; diverse DER siting drives localized control needs |
Rural vs urban feeders: Long rural overhead feeders with light conductor sizes and high R/X experience larger absolute and percent voltage drops for the same load compared with compact urban feeders. Urban designs mitigate drop by limiting LV run lengths via frequent MV/LV substations or by using higher LV classes for large installations (such as 480Y/277 V).
Feeder voltage‑control equipment—line regulators, switched capacitors, and in some cases, regulated substation transformers—are placed based on time‑series studies to maintain voltage within prescribed limits across the daily load cycle.
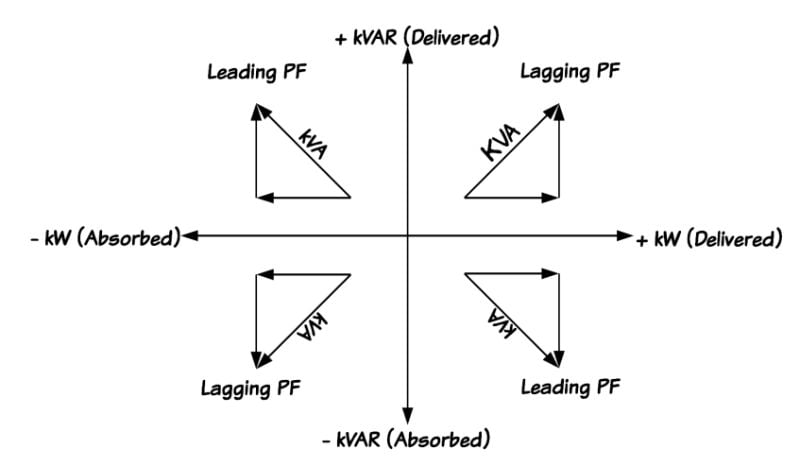
Figure 3. Power factor quadrants. Image used courtesy of Olowu and Sarwat
Practical Notes on Reliability and Protection
Both network topology and external disturbances shape distribution reliability. Radial feeders are cost‑effective and simple to protect, but they expose downstream customers to upstream faults. Interconnected secondary networks and spot networks increase continuity—common in dense downtowns—but require specialized protection and equipment.
Utility data attributes a large portion of sustained outages to vegetation, weather, and wildlife. Utilities address these issues with targeted automation (such as reclosers and sectionalizers) and vegetation management.
On protection, overcurrent coordination remains the baseline for radial MV feeders, with device settings graded to isolate the smallest possible section. As DER penetrations rise, directional elements and adaptive coordination increasingly appear in utility standards because fault current can flow from multiple sources and in reverse directions, and inverter fault contributions can be limited or short‑duration.
IEEE 1547‑2018 sets expectations for DER voltage/reactive power behaviors that help maintain service voltage while preserving protection selectivity.
Conclusion
Distribution systems translate bulk electric power into safe, usable service where it matters most. Their position in the value chain brings a unique combination of responsibilities—voltage quality at the PCC, high spatial exposure, and the need to coordinate protection at generally lower fault levels—while serving as the primary interface for DER growth.
Standardized primary and secondary voltages from IEC 60038 and IEEE‑aligned interconnection rules (IEEE 1547‑2018) provide a common technical foundation. Effective design turns on balancing feeder capacity, voltage‑drop constraints, and placement of transformers and regulators to match load density and topology.
In rural contexts, long high‑R/X feeders demand vigilant voltage control and vegetation management. In urban networks, shorter runs enable tighter voltage bands and higher reliability, but at higher unit costs and with more complex protection. Across contexts, effective application of standardized voltage classes, verified line‑drop calculations, and modern controls provides a resilient path to accommodate load diversity, integrate DERs, and sustain reliability.