Facebook
 Google
 GitHub
 Linkedin
Solar Manufacturing Can Cut Carbon Emissions With 3 Changes
Analysis shows that choices in location, grid mix, and cell technology shifts shape the environmental footprint of next-generation photovoltaics.
We’re steaming ahead toward multi-terawatt annual global solar capacity, but how do we continue to scale photovoltaic manufacturing without proportionally scaling its environmental impact? That’s a question a Northumbria University research team set out to answer.
The team modeled the long-term environmental impact of solar panel manufacturing and discovered that optimizing manufacturing location, electricity sources, and metalization could reduce total solar manufacturing emissions by up to 8.2 gigatons of carbon dioxide by 2035.
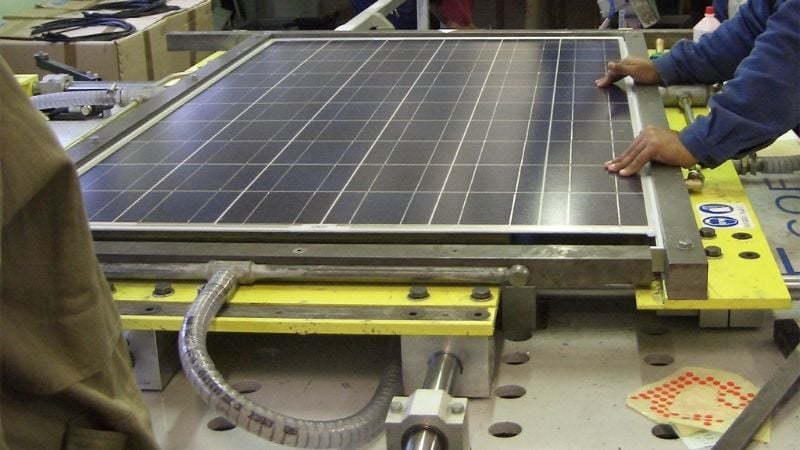
Solar panel manufacturing. Image used courtesy of Wikimedia Commons
Cradle-to-Gate Assessment of PV Manufacturing
The team modeled the life cycle impacts of mainstream crystalline silicon PV modules through 2035, comparing legacy p-type PERC designs with newer n-type TOPCon alternatives. The results suggested that manufacturing location, electricity mix, and metalization choices could reduce cumulative PV manufacturing emissions by up to 8.2 gigatons of CO₂ equivalent (CO2e) by 2035, even as total installed capacity rises sharply.
The work used a cradle-to-gate life cycle assessment based on the EU Environmental Footprint 3.1 framework, spanning 16 impact categories. Modules were modeled as dual-glass designs and normalized per watt-peak to account for efficiency differences. Manufacturing was assumed to take place in major production regions, with shipping to central Europe for consistency.
The study appeared in Nature Communications.
Gains and Tradeoffs
The transition from PERC to TOPCon is already well underway in commercial production. According to the study’s model, TOPCon modules reduced climate change impact per watt by 6.5% relative to PERC under a baseline China-to-Europe supply chain. Across the 16 impact categories assessed, TOPCon performed better in 15 of them.
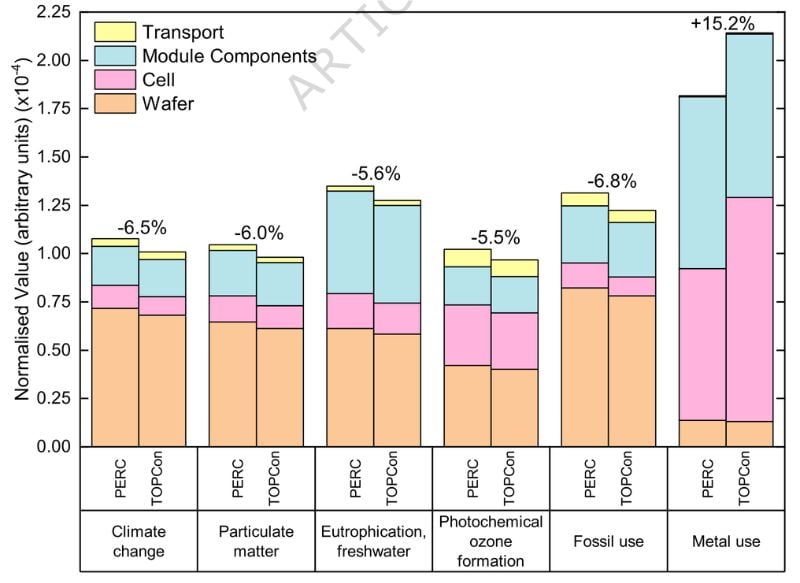
Comparing PERC to TOPcon in six impact categories. Image used courtesy of Willis et al.
The exception was metal use, particularly silver, which increased by 15.2% in the TOPCon case. While efficiency improvements reduced material intensity in some areas, higher silver loading in next-generation designs increased pressure on mineral resource indicators.
This divergence illustrates a broader point: reducing greenhouse gas intensity does not automatically reduce all environmental burdens. Engineers and manufacturers optimizing for carbon must also consider critical material demand, especially as global PV output climbs toward terawatt-scale annual additions.
The study’s hotspot analysis identifies the wafer stage as the dominant contributor in 12 of the 16 impact categories for TOPCon modules. In contrast, electricity consumption during polysilicon purification and ingot and wafer processing remains the primary source of embodied emissions. Metalization then becomes the key contributor to mineral resource use.
Manufacturing Location and Grid Mix Matter Most
While changes in cell architecture produced measurable gains, the largest lever identified was decarbonizing electricity in manufacturing regions.
Modeling of deployment scenarios through 2035 indicated that cumulative PV manufacturing emissions could reach as high as 13.8 Gt CO₂e under less favorable conditions. By contrast, shifting production to regions with cleaner electricity mixes and accounting for grid decarbonization trajectories could reduce that figure by up to 8.2 Gt CO₂e.
The contrast reflects the concentration of energy-intensive steps, such as polysilicon production in regions with varying grid carbon intensity. The study quantified climate change impact per watt for different manufacturing geographies and showed that regional electricity profiles can nearly halve embodied emissions in some cases.
CO2e projections by region. Image used courtesy of Willis et al.
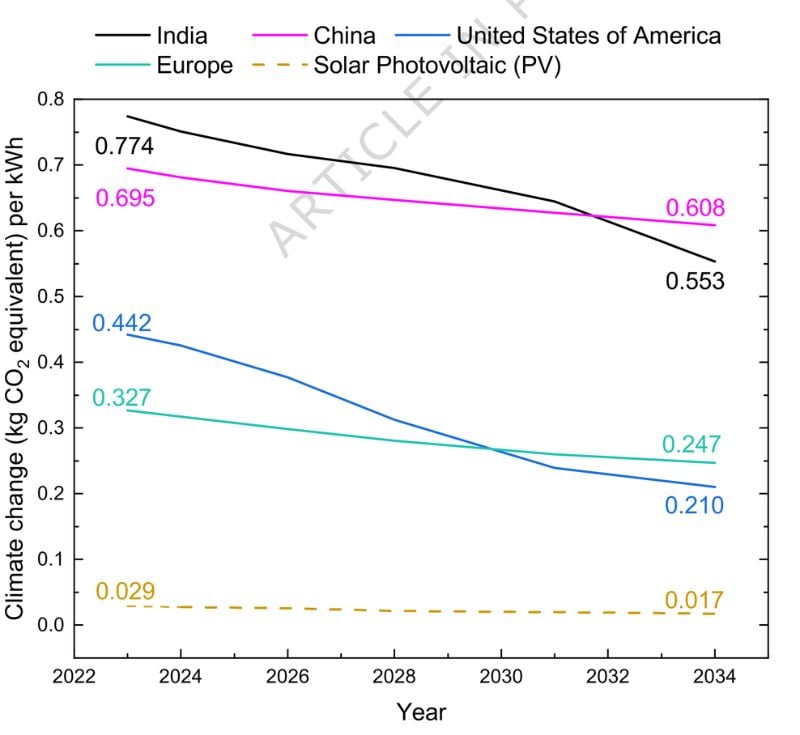
By 2035, the modeled PV pathway achieved roughly 0.017 kg CO₂e per kWh of generated electricity. For comparison, contemporary grid intensitied 0.608 kg CO₂e per kWh in China and 0.210 kg CO₂e per kWh in the United States. Even accounting for manufacturing emissions, the avoided emissions from PV generation between 2023 and 2035 exceeded 25 Gt CO₂e in the modeled deployment scenario.
That figure was based on 94,602 TWh of PV electricity generation over the period and reflected less than half of a typical 30-year module lifetime, suggesting that long-term avoided emissions would be higher.
Silver, Copper, and Material Intensity
The increase in metal resource impact under TOPCon reflects an industry-wide tension around silver demand, which remains the dominant material for front-side metalization in most high-efficiency crystalline silicon cells. At terawatt production levels, even small increases in milligrams per watt translate into substantial tonnage.
Industry roadmaps have already targeted significant reductions in silver intensity, and copper-based metalization approaches are moving toward commercial scale. The study does not model specific copper substitution pathways in detail, but its mineral resource results underscore the importance of continued progress in that direction.
The researchers also referenced emerging product carbon standards, such as EPEAT thresholds for photovoltaic modules, including 630 kg CO₂e per kWp for registration and 400 kg CO₂e per kWp for Climate+ designation. Meeting those benchmarks depends heavily on where and how modules are manufactured.
As solar capacity expands to meet climate and electrification targets, the manufacturing footprint will become a design variable in its own right. This study isn’t saying that PV must scale, but that it can do so with significantly lower cumulative impact if technology transitions and grid decarbonization proceed in parallel.