Facebook
 Google
 GitHub
 Linkedin
Renewables Roundup: Growth and Gridlock
How are renewables and energy storage faring worldwide? Here’s an update.
Policy support, favorable prices, and market demand continue to spell promise for renewable energy and storage developers, though interconnection backlogs and grid constraints remain significant.
This roundup will cover three recent developments, including a progress update on United Nations 2030 targets, China’s cleantech dominance, and energy storage growth in the U.S.
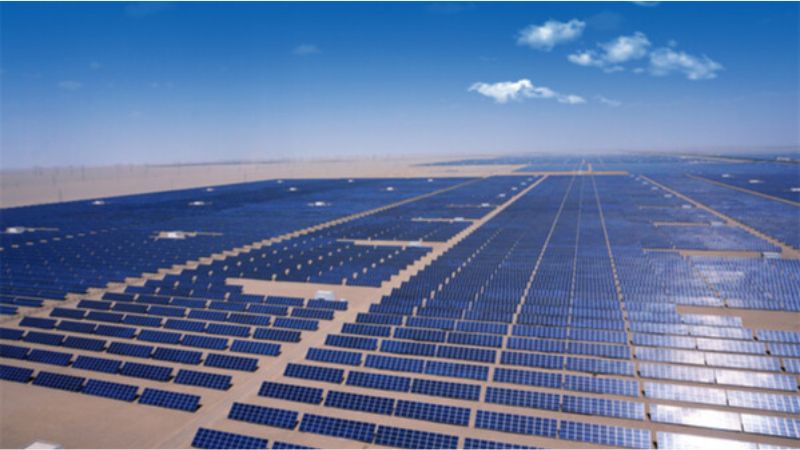
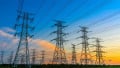
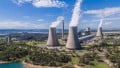
The 20-MW Dunhuang Huineng solar project in Gansu, China. Image used courtesy of Power Construction Corporation of China
IEA Flags Renewable Integration Needs
In its Renewables 2024 report, the International Energy Agency (IEA) outlined several barriers in the United Nations’ 2030 plan to triple renewable energy worldwide. Although the report expects capacity to jump 2.7 times and surpass countries’ existing goals by almost 25%, projections still fall below the 3x target that nearly 200 countries agreed to at last year’s COP28 summit. The IEA cited expanding grid infrastructure by more than 15 million miles and adding 1.5 TW of energy storage capacity to counter solar and wind intermittency.
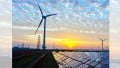
Still, growth isn’t slowing down. Over 5.5 TW of renewable energy capacity will come online by 2030, averaging about 940 GW annually—70% more than last year’s record. Global renewable generation is expected to reach 17,000 TWh by 2030, up nearly 90% from 2023. That’s enough to meet the power demands of the U.S. and China by the decade’s end.
The IEA also anticipates that capacity growth will double in the U.S. and European Union over the next six years. However, the report advised that European and U.S. governments should reduce permitting delays and invest in grid capacity and flexible assets to incentivize deployments. India should address land procurement issues, connection queues, and financial concerns for power distribution providers. China should address grid integration constraints and increase distributed solar installations.
_progress_by_country_and_phase.jpg)
Variable renewable energy integration (shown as “VRE” in the chart) progress by country and phase. Image used courtesy of IEA
Interconnection backlogs are increasing worldwide. More than 1.6 TW of renewable capacity is currently sitting in queues, 150 GW more than a year ago. Energy storage connections are also delayed, requiring higher curtailment to maintain flexibility with wind and solar. Despite growing battery storage investments, long-duration energy storage and large-scale demand response assets remain in high demand.
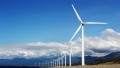
The wind sector will likely overcome recent bottlenecks as permitting and interconnection queues subside. Governments are also updating their auction models in Europe, the U.S., and India. Wind is expected to double by 2030 compared to 2017-2023 levels, while hydropower will remain stable. However, other renewables like geothermal, ocean energy, and concentrated solar power will likely decline without policy support. The IEA is also less optimistic about hydrogen, accounting for less than 1% of the global expansion.
China Dominates Global Renewable Energy Growth
The IEA’s Renewables 2024 report spotlighted China as a renewable energy leader, claiming 60% of the global expansion by 2030. The country is expected to meet its 2030 target six years early, adding 1.2 TW of solar and wind.
Some growth is due to China discontinuing feed-in tariffs in 2019. As a variable electricity price subsidy, the program incentivized over a decade of solar PV and onshore wind projects. The government is now transitioning to auctions, local grid parity terms, and quotas. Since feed-in tariffs ended, solar additions nearly tripled to 261 GW last year. China’s cumulative solar capacity has almost quadrupled, while wind has doubled.
China will install 3.2 TW of renewable capacity by 2030, tripling 2017-2023 growth levels. The IEA cited the national goal to reach net-zero emissions by 2060, supported by government incentives, domestically manufactured equipment, and affordable financing.
These expansions have doubled China’s share of global renewable output, though Europe and the U.S. are still expected to contribute nearly 30% by 2030. China’s solar and wind costs are near or below coal generation.
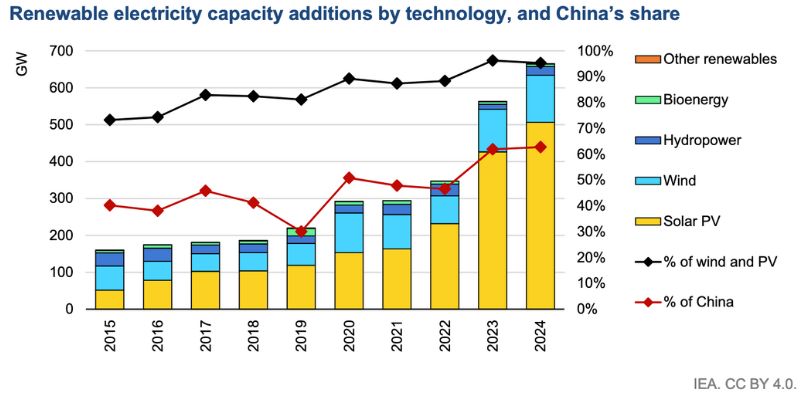
Renewable capacity growth by technology, including China’s share. Image used courtesy of IEA (Page 29)
The IEA cited other factors driving China’s latest growth. The nation’s utility-scale solar PV additions more than tripled due to last year’s so-called “supply glut,” which led to a 50% reduction in module prices as companies stockpiled units imported into Europe and the U.S. The Chinese government also implemented a policy supporting large-scale solar construction in deserts and remote areas.
China’s renewable capacity additions are projected to increase by 20% this year, but grid integration remains a significant challenge. China’s energy regulator recently upped the provincial curtailment threshold from 5% to 10% to clear more solar PV capacity connections.
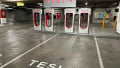
U.S. Energy Storage Update
Wood Mackenzie’s latest Energy Storage Monitor found that U.S. installations grew 74% year-over-year in the second quarter, totaling 3 GW. Most of this expansion came from grid-scale capacity additions (2.7 GW/9.9 GWh) in California (with a 40% share), followed by Texas and Arizona. The report counted another 238 MW/510 MWh of distributed storage installations.
National residential storage attachments also hit a record 26%, though installations dropped 15% quarter-over-quarter. California led with a 70% attachment rate, with most Q2 installations falling under the state’s Net Billing Tariff. Community-scale, commercial, and industrial (CCI) installations bounced back from last quarter’s lull, again with California setting a quarterly record (14.4 MW).
Despite this growth, the 2024 forecast remains relatively unchanged from last quarter at 12.7 GW/36.7 GWh. Wood Mackenzie expects total storage deployments will increase 42% since 2023, and grid-scale capacity will rise 32% to 11 GW/32.7 GWh. Over 6 GW of projects are under construction today.
Beyond that, capacity additions could plateau between next year and 2028, with deployments growing 7.6% annually. This could change since American suppliers and prospective U.S. entrants are hesitant to set growth plans until after November’s election. Meanwhile, grid-scale prices are declining modestly, though growth could flatten in 2025 and 2026 amid lengthy permitting and interconnection timelines. CCI’s projected 2.5 GW marks a slight reduction from the last forecast due to financial concerns and project complexity.
Wood Mackenzie foresees 12 GW of distributed storage in the next five years, with residential claiming 80% of capacity additions. However, this growth will slow as California transitions away from net metering. Developers have until 2026 to install eligible projects in the state.