Facebook
 Google
 GitHub
 Linkedin
Sensorless Method Detects Solar Faults Using Inverter Data Only
Australian researchers have developed software that detects photovoltaic underperformance using only standard AC inverter data.
Researchers have developed a method to detect and classify underperformance in photovoltaic (PV) systems using only alternating current side data from inverters. This approach bypasses the need for high-resolution direct-current sensors or complex on-site hardware, allowing teams to create useful diagnostics from five minutes of power data.
In monitoring large distributed PV fleets, conventional fault detection, which uses expensive irradiance sensors or thermal imaging, is too expensive and impractical. Instead, using existing data streams and system metadata, the team from University of Technology Sydney, Diagno Energy, and the University of New South Wales found a solution that demonstrated 92% accuracy.
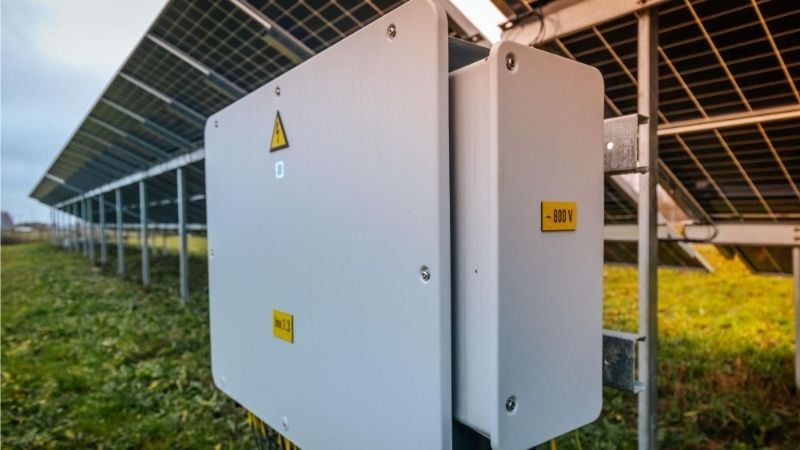
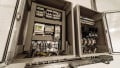
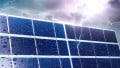
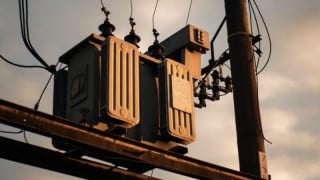
Solar inverter. Image used courtesy of Adobe Stock
Automated Detection and Classification With AC Time-Series Data
To enable large-scale monitoring without specialized hardware, the researchers designed a dual-resolution pipeline to process five-minute AC power measurements and system metadata.
The first stage of the pipeline involves a daily performance screening to calculate the ratio of measured generation to an expected baseline. This baseline combines a PV performance model with clear-sky reference data from local weather stations to distinguish cloud cover from actual system faults.
To guarantee reliability, the team set specific thresholds to trigger alerts, such as alerting for major underperformance if the measured-to-expected ratio falls below 60% for three consecutive days.
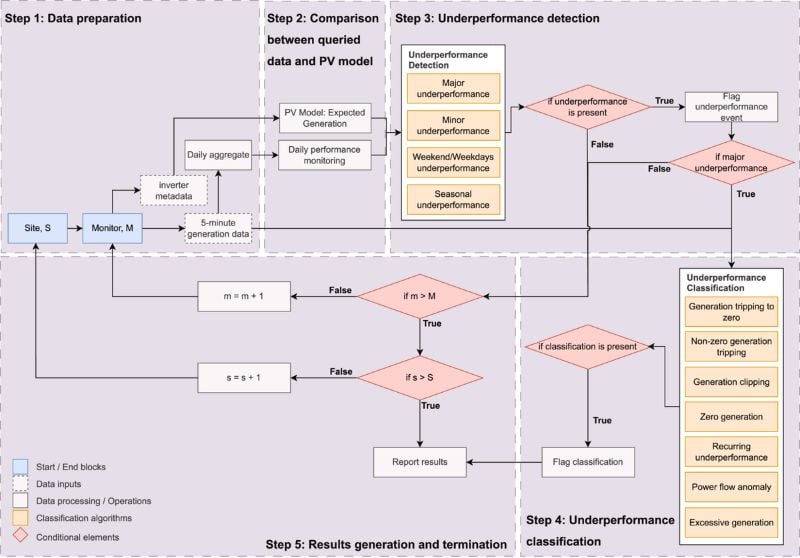
Workflow for detecting PV system underperformance. Image used courtesy of Severiano et al.
The second stage uses high-resolution analysis to classify specific fault types by identifying unique signatures in the power curve. Specialized algorithms detect events such as inverter tripping or recurring daily underperformance by comparing real-time output to historical trends. For example, the power flow anomaly algorithm detects intervals in which the inverter reports negative generation, allowing the researchers to pinpoint sensor calibration errors or atypical export limits.
To prove these features, the researchers tested the framework on a dataset of 1,089 Australian PV systems. They found the software had a 92% accuracy for major underperformance events. This high detection rate ensures that maintenance teams for solar systems can prioritize safety-critical or revenue-impacting problems that might otherwise stay hidden in raw data.
Understanding Performance Ratio in Photovoltaic Monitoring
The performance ratio (PR) is an important metric for evaluating how effectively a photovoltaic system converts available solar energy into usable electricity. While simple yield measurements only report total energy produced, the PR provides a normalized value by comparing actual output to the theoretical maximum potential of the system under specific environmental conditions.
This calculation accounts for factors such as sunlight intensity, array orientation, and the equipment's rated capacity. By isolating these external factors, the PR allows solar engineers to directly gauge a system's internal health and efficiency.
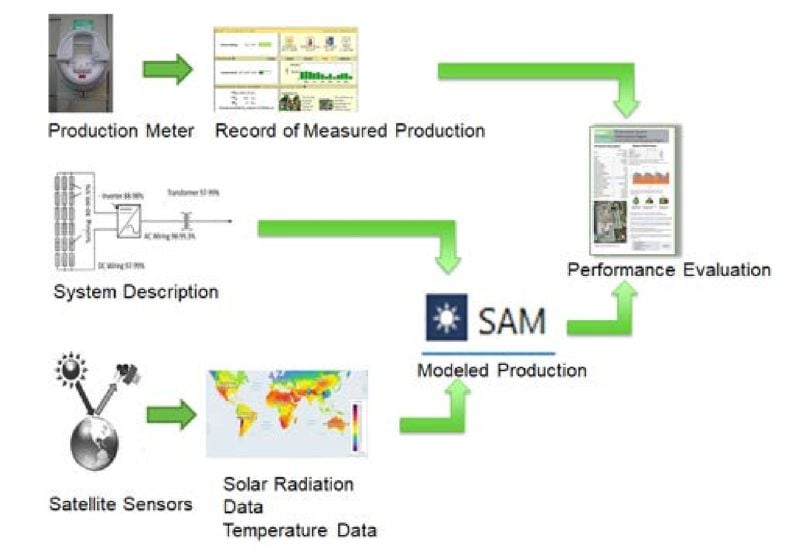
Overview for calculating a performance ratio. Image used courtesy of the U.S. Department of Energy.
Maintaining a high PR is necessary for the economic viability of solar investments, with updated systems expected to operate with a ratio above 0.80.
When a PR falls below this level, the internal constraints or environmental stressors on the PV system reduce energy production. Common stressors include partial shading, where an obstructed area on a single panel disproportionately reduces the output of an entire string, or soiling from accumulated debris.
Furthermore, the natural degradation of semiconductor materials reduces the PR over time, typically 0.5% to 1% annually. Monitoring this ratio provides a consistent baseline for identifying exactly when a system requires maintenance to prevent long-term financial losses.
Advanced Diagnostics for Fleet Reliability
The researchers' approach suggests that smarter software can provide a clearer view of solar health without adding to the hardware costs for customers. This method lets fleet operators prioritize high-impact faults for immediate repair while scheduling minor issues for routine maintenance, lowering cost and overhead.
Because their method relies on standard AC-side data, energy retailers can provide diagnostic upgrades as a software service to existing customers.
Currently, this method remains an experimental research framework, though it has been tested on 2,213 monitors from eight major inverter brands. It will only become widely available when these research institutions share their technologies with industry monitoring platforms.