Facebook
 Google
 GitHub
 Linkedin
Distribution System Fundamentals—Part 2: Topologies and Reliability
Explore distribution topologies, from simple radial feeders to complex networks, and examine reliability metrics, common causes of outages, and modern strategies for grid resilience.
Electric distribution systems have evolved from simple, single‑source feeders to complex, automated networks that must deliver high reliability while accommodating distributed energy resources (DERs), electric vehicles (EVs), and more dynamic operational states.
This article reviews practical topologies found in the field, explains reliability metrics and their calculation, identifies common outage drivers, and outlines emerging strategies that address reliability in modern distribution operations.
Distribution Network Topologies
Radial Systems
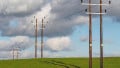
Radial feeders are the simplest and most prevalent arrangement: a single source at the substation supplies downstream customers in a tree‑like structure. Because current flows in one direction, time–current coordination among protective devices (such as substation breaker, downstream reclosers, fuses) is comparatively straightforward. This simplicity enables cost‑effective construction and easy expansion, which explains the prevalence of radial designs across suburban and especially rural territories where load density is low and line miles per customer are high.
Typical applications include long rural laterals that serve farms, small towns, and dispersed residential developments. In such settings, radial feeders are frequently equipped with sectionalizing fuses and one or more-line reclosers to clear temporary faults and restore service automatically after transient events.
Limitations arise because a single permanent fault can interrupt all load downstream of the device that isolates it. Although switching to alternate sources or ties is sometimes possible, classic radial designs do not inherently provide a second energized path; as a result, momentary and sustained interruption indices tend to be less favorable than in looped or networked configurations.
Loop (Ring) Systems
Loop (ring) systems connect two or more feeders so that loads can be supplied from either direction. In common practice, the loop operates “normally open” at one or more tie points to maintain simple fault levels and directional protection; under contingency, automatic transfer closes the tie and opens a faulted section, feeding the healthy segment from the alternate side. Ring Main Units (RMUs) at medium voltage consolidate the necessary switches/breakers and allow compact, modular construction around urban blocks or industrial parks. RMUs are widely used in ring‑type distribution and can include vacuum or gas‑insulated interrupters with protective relays integrated in the cabinet.
Automatic sectionalizing switches and smart reclosers enable fault location, isolation, and service restoration without manual patrols. In a normally open loop, a permanent fault triggers opening of the nearest sectionalizing devices and, if needed, the tie closes to backfeed intact sections. This architecture materially reduces the number of customers interrupted and the average interruption duration relative to simple radial operation, while keeping day‑to‑day protection coordination manageable.
Networked Systems
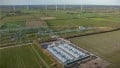
Networked secondary systems—implemented as spot networks or grid (area) networks—are designed for very high service continuity. In grid networks, multiple primary feeders from one or more substations energize many network transformers whose secondaries are paralleled on a common low‑voltage grid serving dense downtown loads. A spot network is a localized variant: two or more transformers feed a single secondary bus serving a single facility or campus. Both arrangements are common in urban cores requiring maximum reliability and flexibility.
Because multiple sources operate in parallel, networked secondaries employ network protectors—reverse‑power protective breakers installed on each transformer secondary. A network protector opens when reverse flow toward the primary is detected (such as during a primary feeder outage), preventing unsafe backfeed and allowing maintenance or fault clearing on the primary side while service to the secondary grid continues from other sources. This device is foundational to secure parallel operation and also central to managing reverse flow in the presence of DERs on networked secondaries.
Key technical consequences of networked operation include:
- Higher available fault current at the secondary due to the contribution of multiple paralleled sources.
- More complex protection and equipment ratings on the low‑voltage network.
- Enhanced reliability via supply path diversity and the ability to switch and maintain equipment without interrupting most loads.
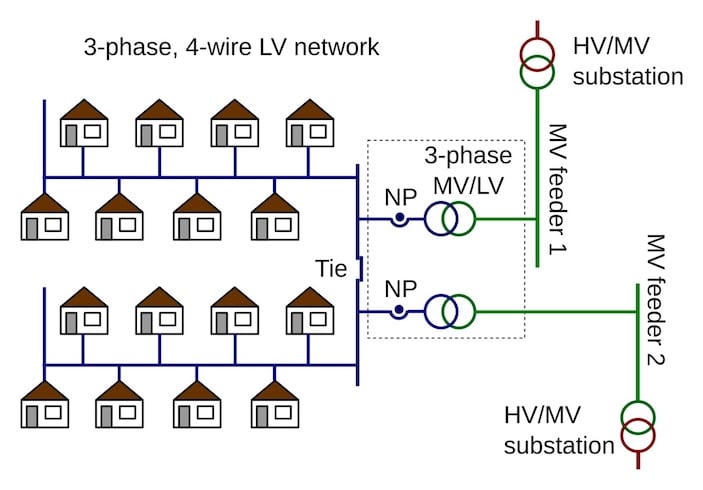
Figure 1. Spot network layout. Image used courtesy of Wikipedia.
Comparative Technical Evaluation
| Attribute | Radial | Loop (Ring) | Networked (Spot/Grid) |
| Fault current implications | Lowest prospective currents; single source simplifies device duties | Higher than radial at tie points; still limited by normally-open operation | Highest at secondary due to multiple paralleled sources and short low-voltage paths |
| Protection complexity | Simplest time–current coordination; directional logic often unnecessary | Moderate; logic for sectionalizing and tie control, some directional elements | Highest; specialized low-voltage protection (network protectors), complex primary/secondary coordination |
| Capital vs. reliability trade-offs | Lowest capital cost; lower reliability under permanent faults | Moderate capital; significant reliability gains via fast isolation and backfeed | Highest capital; highest reliability and operational flexibility for dense urban loads |
| Load transfer capability | Limited; requires manual switching or predefined ties | Strong; automatic or supervised backfeed after isolation | Intrinsic; parallel operation allows switching and maintenance with minimal service impact |
Reliability Engineering in Distribution Systems
Key Reliability Metrics
Three customer‑centric indices are widely reported following IEEE guidance and regulatory practice:
- SAIDI (System Average Interruption Duration Index): Average cumulative outage duration experienced by customers over a period.
$$SAIDI = \frac{\Sigma U_iN_i}{N_T} = \frac{\text{sum of all customer interruption durations}}{\text{total number of customers served}} $$
where Ui is the outage duration for event i, Ni is the number of customers affected by event i.
- SAIFI (System Average Interruption Frequency Index): Average number of interruptions experienced by customers over a period.
$$SAIFI = \frac{\Sigma \lambda_iN_i}{\Sigma N_i} = \frac{\text{total number of customer interruptions}}{\text{total number of customers served}}$$
where λi represents the occurrence of a sustained interruption event i.
- CAIDI (Customer Average Interruption Duration Index): Average time required to restore service to interrupted customers.
$$CAIDI = \frac{\text{sum of all customer interruption durations}}{\text{total number of customer interruptions}} = \frac{SAIDI}{SAIFI}$$
Note that denominator for SAIFI is written as ∑Ni, while for SAIDI it is written as NT. Both terms represent the total number of customers served, and are mathematically equivalent (NT = ∑Ni).
Regulators and utilities often report indices with and without Major Event Days (MEDs) following IEEE Std 1366 practice. The U.S. Energy Information Administration (EIA) provides definitions and notes common reporting conventions for reliability statistics used in industry filings.
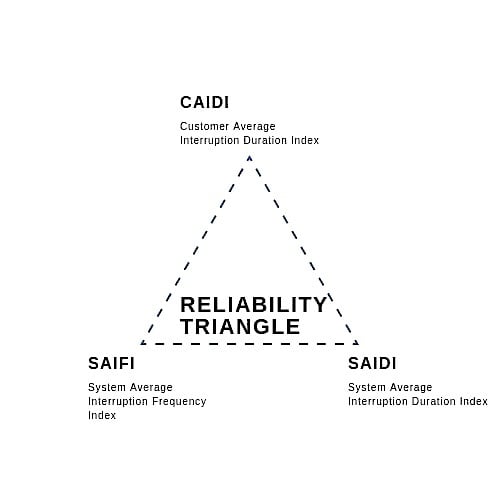
Figure 2. Reliability triangle. Image used courtesy of Sitetracker.
Causes of Distribution Interruptions
Weather‑related outages: Across the United States, the majority of major outages since 2000 have been associated with severe weather, including convective storms, snow/ice, tropical cyclones, extreme heat, and wildfires. Climate Central’s multi‑decade analysis attributes roughly 83% of reported major outages (2000–2021) to weather‑related events, with convective storms contributing the largest share.
Vegetation contact: Wind and storm‑driven vegetation are recurring causes of line faults, producing transient or permanent outages. These events are concentrated on overhead distribution infrastructure, and their frequency is sensitive to right‑of‑way maintenance cycles; multiple regional reliability analyses link vegetation to a large fraction of weather outage impacts.
Equipment failure (transformers, arresters, cables): Aging assets and thermal/mechanical stresses lead to failures; on underground laterals, cable and splice defects are typical root causes, while on overhead feeders, aging arresters and switchgear are common contributors. Utility studies also connect sustained overloads (such as transformer hot‑spot excursions) to accelerated insulation aging.
Protection miscoordination and misoperations: While formal reporting frameworks emphasize bulk electric system (BES) elements, the underlying causes of protection misoperations—incorrect settings, logic errors, relay failures, and communication issues—are equally relevant to distribution networks. At the distribution level, such miscoordination can leave faults uncleared locally, extend outage duration, or unnecessarily trip large sections of feeder.
Reliability Improvement Strategies
Feeder automation (FLISR): Fault location, isolation, and service restoration applications automatically operate switches and reclosers to minimize the size and duration of outages. Implementations range from local logic in field devices to centralized ADMS‑based schemes. Utility deployments have demonstrated measurable reductions in SAIDI/SAIFI by restoring healthy sections in seconds instead of minutes.
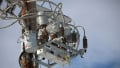
Sectionalizers and reclosers: Properly placed reclosers clear temporary faults and coordinate with downstream fuses; sectionalizers count fault current pulses and open on the next interruption to isolate a section. Automated tie switches provide service from an alternate source where thermal and voltage limits allow.
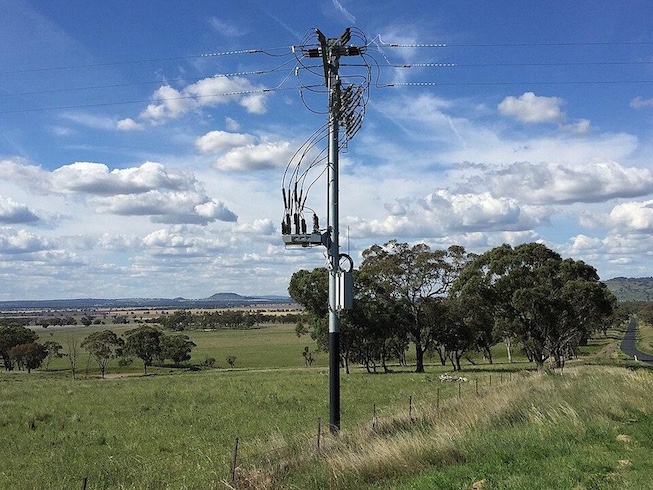
Figure 3. Recloser installation on a rural distribution feeder. Image used courtesy of Wikimedia.
Undergrounding trade‑offs: Burying lines significantly reduces exposure to wind and vegetation, improving outage frequency and storm resilience, but initial costs are multiple times those of overhead construction. For example, recent utility filings in California cite underground conversion costs of about $3 million per circuit-mile—often many times higher than comparable overhead construction—while studies in other regions report cost differentials of roughly 4 to 10 times depending on terrain and design. At the same time, DOE’s ARPA‑E GOPHURRS initiative is advancing technologies aimed at lowering undergrounding costs and accelerating deployment.
Predictive maintenance: Sensors and analytics—such as dissolved‑gas and partial discharge monitoring for substation assets, feeder‑mounted line sensors, and ADMS analytics—support condition‑based interventions before failures cause interruptions. Utility analyses highlight the role of DA (distribution automation) and data analytics in improving reliability and O&M outcomes.
Emerging Reliability Challenges
DER backfeed and reverse power flow: High PV or storage export can reverse feeder and transformer flows, affecting voltage profiles, transformer thermal cycles, and protection coordination. Standards guidance addresses overvoltage, hosting capacity, and protection impacts; field studies document transformer loading risks under persistent reverse flow and identify mitigations such as smart inverter controls, storage, and adaptive settings. On networked secondaries, network protectors’ reverse‑power logic is a central constraint and focus of modernization to accommodate bidirectional flow safely.
Electric vehicle clustering: Concentrated Level‑2 charging in residential neighborhoods can push service transformers into overload and raise feeder peaks. Modeling and field studies indicate that moderate to high EV adoption can necessitate transformer upgrades if managed charging is not implemented; planning tools (such as NREL’s EVI‑DiST) and managed charging strategies help quantify and mitigate these impacts.
Increased switching complexity: With more automated devices, dynamic feeder reconfigurations, and DER‑dependent fault currents, coordination logic becomes more scenario‑dependent. FLISR must account for changing contributions from inverter‑based resources, potentially requiring adaptive settings or coordinated protection and control logic to avoid misoperations during restoration.
Cyber‑physical vulnerabilities: Distribution automation, DERMS interfaces, and field IEDs expand the attack surface. IEEE 1547.3‑2023 provides cybersecurity guidance for DER interconnections, and recent research outlines frameworks for risk assessment and detection of false‑data or control attacks at the grid edge. Defense‑in‑depth, authenticated/encrypted communications, and anomaly detection are becoming standard requirements in distribution operations.
An New Interconnected Era
Distribution engineering now operates at the intersection of classical feeder design and modern, data‑driven automation. Radial systems still serve vast territories efficiently; looped feeders provide practical gains in restoration speed and operational flexibility; and networked systems supply the highest service continuity required in urban cores. Reliability engineering depends on a clear understanding of SAIDI, SAIFI, and CAIDI—and on systematic efforts to reduce both the frequency and duration of interruptions.
Weather remains a dominant driver of large outages, making hardening and automation central priorities. Practical investments—smart reclosers, sectionalizers, and FLISR—deliver measurable improvements when paired with disciplined protection coordination and operational limits for load transfer. Undergrounding can deliver substantial resilience gains in select corridors, provided capital and lifecycle implications are evaluated with local conditions in mind.
At the same time, DERs and EV charging are transforming feeder behavior—introducing reverse flow, altering fault current profiles, and raising thermal and switching constraints. These trends elevate the importance of adaptive protection, hosting capacity analysis, and coordinated control across ADMS, DERMS, and field IEDs, implemented with robust cybersecurity aligned to emerging standards. The path forward combines topology choices with automation, targeted hardening, and data‑guided operations to sustain reliability as distribution systems become more active and interconnected.