Facebook
 Google
 GitHub
 Linkedin
Distribution System Fundamentals—Part 3: Emerging Trends
This article provides analysis steps and implementation strategies for distributed energy resource behavior, transportation electrification, and sensor-driven modernization.
Distributed energy resources (DER) are reshaping electrical distribution networks, accelerating transportation electrification, and expanding the suite of grid‑modernization technologies. The fundamentals remain grounded in power flow, protection, and voltage quality, yet everyday engineering practice now requires fluency in new data sources, device capabilities, and planning methods.
Engineers should evaluate three core areas: DER behavior and hosting capacity, transportation electrification impacts, and modernization through feeder-level sensors and AMI. They must then link these concepts to practical analysis steps and implementation guidance.
Distributed energy sources. Image used courtesy of Adobe Stock
Distributed Energy Resources (DER)
Bidirectional Power Flow
High DER penetration turns historically radial, one‑way feeders into networks with frequent reverse power flow at lateral or even substation points. This alters:
Protection coordination: If DER reduces upstream fault current or if reverse current appears during faults, traditional time-current curves and fuse‑saving strategies can misoperate. Directional elements and revised settings are necessary when reverse power flow is credible, and IEEE 1547‑2018 establishes interoperability capabilities that influence protection and voltage-control expectations.
Voltage regulation: In high R/X feeders, real‑power injection from photovoltaic systems raises local voltage. Smart inverters with volt/VAR and volt/watt mitigate this, often reducing the need for tap operations. Voltage targets remain bounded by ANSI C84.1 service‑voltage ranges (Range A is typically ±5% for ≤600 V systems), which are commonly used as steady‑state limits in planning studies.
For analysis, the LinDistFlow approximation is widely applied to quantify voltage sensitivity to P and Q along radial feeders. In single‑phase form:
$$\omega_j = \omega_i - 2r_{ij}P_{ij} - 2x_{ij}Q_{ij}$$
where ⍵ is squared voltage magnitude, and rij, xij are branch parameters. This relation provides a transparent link between local DER injections and voltage profiles used in volt/VAR studies and screening analyses.
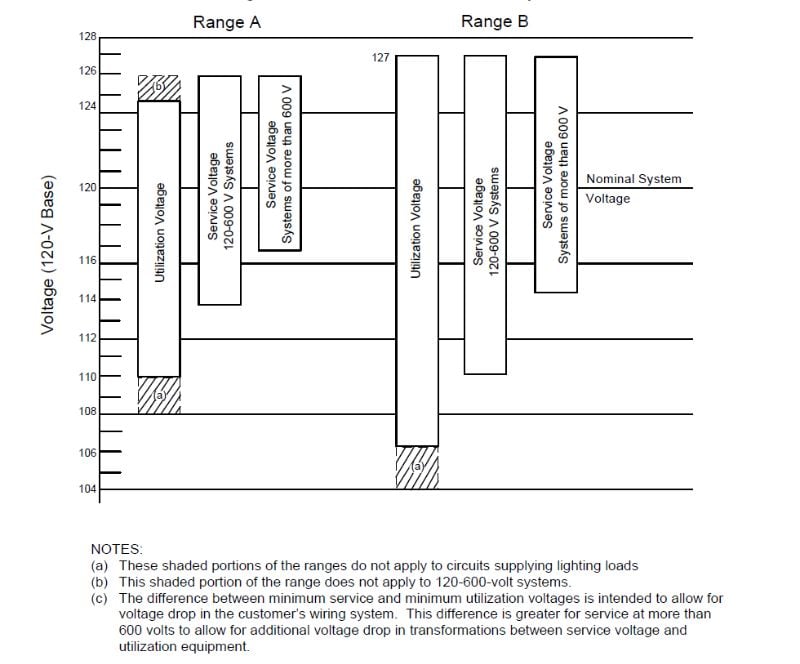
Figure 1. Voltage ranges, ANSI C84.1. Image used courtesy of Voltage Disturbance
Hosting Capacity Analysis
Hosting capacity (HC) quantifies the number of DER that can be connected before violating operational criteria (such as voltage, thermal, protection, and power‑quality limits) without infrastructure upgrades. Berkeley Lab’s integrated distribution system planning materials, along with the former National Renewable Energy Laboratory’s advanced and dynamic HC, have established clear working definitions.
Three implementation patterns appear in practice:
- Snapshot (static) HC: Evaluates worst‑case periods (such as midday PV peak with minimum load), often conservative because duration and diversity are not modeled
- Time‑series HC: Quasi‑static simulation over a year using feeder models and DER/load profiles; captures duration of limit violations and device deadbands
- Probabilistic/stochastic HC: Samples variability in DER output, load, and topology; provides distributions of violations rather than point estimates
Typical criteria and methods:
- Voltage: Check against ANSI C84.1 service ranges and utility planning bands. Use volt/VAR and volt/watt control to evaluate mitigation.
- Thermal: Conductor and transformer ampacities under DER‑driven backfeed. Include diversity and secondary network detail where relevant.
- Protection: Fault current contribution and reverse‑power scenarios affecting fuse–recloser hierarchy. Consider directional relays and settings groups.
- Power quality: Flicker, unbalance, and harmonics assessments, particularly on multi‑phase laterals under uneven PV siting.
Evidence from research and utility pilots shows that activating smart‑inverter functions (Volt/VAR and Volt/Watt) can materially increase HC. Requirements and capabilities are specified in IEEE 1547‑2018.
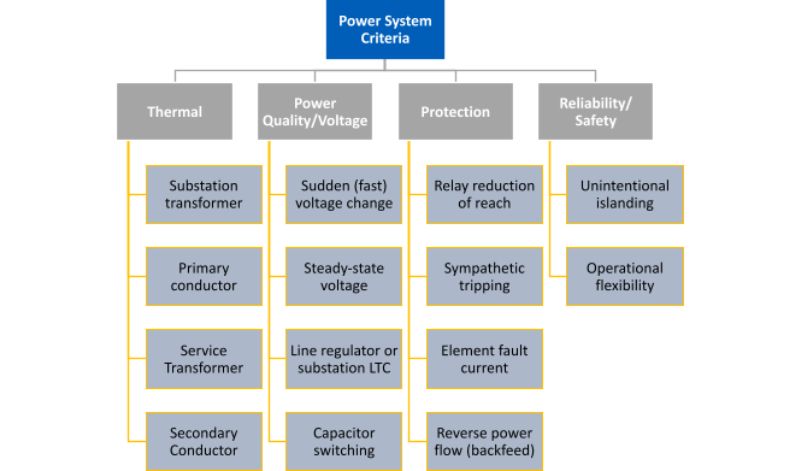
Figure 2. Power system criteria for hosting capacity. Image used courtesy of Energy Markets and Planning
Electrification of Transportation
Transformer Overloading Risks
Concentrated electric vehicle charging can push residential service transformers beyond nameplate for extended periods, accelerating insulation aging and causing protection operations. The IEEE C57.91 Arrhenius‑based model is commonly used to evaluate thermal aging. Two equations are widely used in utility studies.
First, the Aging Acceleration Factor is given by:
$$FAA = \exp{(\frac{15000}{383} - \frac{15000}{(\theta_H + 273)})}$$
where θH is hottest‑spot temperature in °C.
if θH > 110°C, then FAA > 1 – Faster Aging
if θH < 110°C, then FAA < 1 – Slower Aging
Second, the Equivalent Aging Factor is defined as:
$$FEQA = \frac{\Sigma_{i=1}^N (FAA_i ~\cdot ~ \Delta t_i )}{\Sigma_{i=1}^N \Delta t_i}$$
Where:
Δ ti is duration of time interval i
N is total number of time intervals
These relations connect loading, ambient temperature, and cooling to expected life consumption and enable comparisons between unmanaged and controlled charging scenarios.
A practical engineering workflow is:
- Build time‑series transformer loading from baseline demand plus scenario EV charging (arrival times, state‑of‑charge needs, charging power).
- Compute θH using the transformer thermal model and then FAA/FEQA for loss‑of‑life metrics.
- Evaluate mitigations—managed charging windows, power limits, or phase‑aware scheduling—to keep FEQA near unity across typical seasons. Utility coordination strategies show overload elimination with limited customer‑side impact when charging is shifted away from local peaks.
Voltage Unbalance Issues
Uneven single‑phase EV charger connections can raise negative‑sequence voltage and current, with consequences for motors and LV equipment. Two standard metrics are commonly used to quantify voltage unbalance.
The first is the IEC Voltage Unbalance Factor:
$$VUF = 100~\times~\frac{V_N}{V_P}$$
Where VN and VP are negative‑ and positive‑sequence voltages, respectively.
The second is the NEMA Percent Unbalance:
$$\text{% Unbalance} = 100 ~\times~ \frac{max(~|V_1-V_{avg}|,|V_2-V_{avg}|,|V_3-V_{avg}|~)}{V_{avg}}$$
Where:
V1, V2, V3 are the measured voltages for each of the three phases.
Vavg is the arithmetic average of the three phase voltages.
For EV‑rich neighborhoods, mitigation includes phase‑balancing service drops, assigning single‑phase chargers to balance phases geographically, and considering three‑phase chargers in commercial depots.
Grid Modernization
Smart Sensors at Feeder Level
Modern distribution operations depend on more granular and time‑synchronized measurements. Two families of field sensors are especially impactful:
- Micro‑PMUs (distribution‑level synchrophasors): Provide phasor measurements at 120 samples/s with millidegree‑scale angle precision, enabling oscillation detection, DER dynamic studies, and high‑fidelity event analysis that conventional SCADA does not capture.
- Line sensors, recloser controls, and automated switches for FLISR: Fault indication streams and SCADA‑controllable devices support automated fault location, isolation, and service restoration, with utility deployments showing significant reductions in customers interrupted and minutes out when FLISR is in service.
These sensors also improve state estimation quality and model calibration in feeders with high DER variability. Field experience demonstrates distribution model enhancement and state estimation using high‑speed phasors and feeder‑head data.
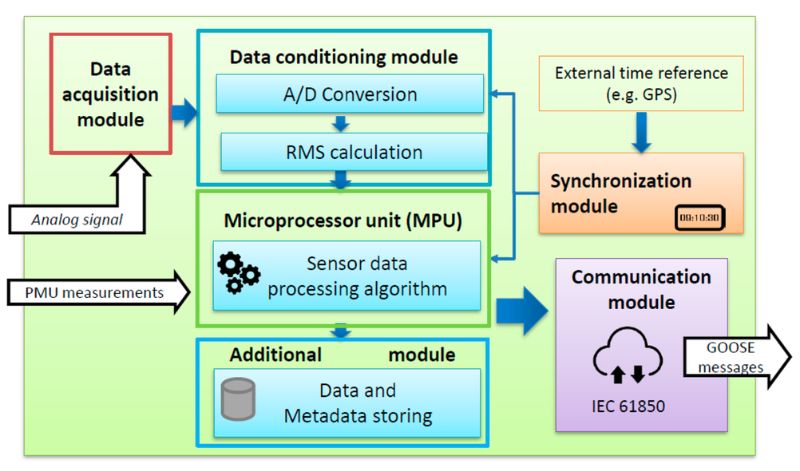
Figure 3. Relay-based smart sensor structure. Image used courtesy of Alonso et al.
AMI Integration Into Operations
Advanced Metering Infrastructure (AMI) has evolved from billing support to a foundational operational dataset. Typical AMI interval data granularity ranges from 15 to 60 minutes—sufficient for feeder‑level load estimation, outage analytics, and volt/VAR planning—while research continues to infer higher‑resolution profiles from lower‑rate data.
Operational use cases include:
- Distribution System State Estimation (DSSE) and pseudo‑measurements: Methods using AMI data, feeder‑head telemetry, and machine‑learning estimators increase observability on secondary networks and improve topology/parameter estimation.
- Outage management and momentary detection: AMI momentary counters and voltage sag flags support localization and restoration verification beyond customer calls.
- Volt/VAR optimization: AMI voltage measurements contribute to feeder‑wide Volt-VAR Optimization (VVO), coordinating legacy devices with DER reactive power functions specified in IEEE 1547.
Table 1. Field issues and common mitigations
| Impact area | What changes in practice | Typical mitigations |
| DER voltage rise | Local overvoltage on sunny, light-load periods | Volt/VAR, Volt/Watt per IEEE 1547; revise tap deadbands |
| Protection | Reverse power flow, altered fault levels | Directional relays; recoordination studies |
| Thermal loading | Backfeed on conductors/transformers | Targeted upgrades; DER control windows |
| EV charging | Transformer overload, secondary drop | Managed charging; power limiting; staggered starts |
Implementation Notes
- Planning criteria: Align voltage checks to ANSI C84.1 steady‑state service ranges. These remain the go‑to screening values and are consistent with equipment expectations.
- Hosting capacity practice: Prefer time‑series or probabilistic approaches when feeder diversity and DER control materially affect the duration of violations. Snapshot HC is often overly conservative.
- Protection modernization: Where DER is prevalent, expect settings groups that consider forward and reverse power conditions. Document assumptions about DER ride‑through and reactive support per IEEE 1547‑2018.
- Sensor strategy: Blend μPMUs at strategic buses with line sensors on long laterals to improve DSSE and FLISR performance, enhancing event diagnosis and feeder model accuracy.
- AMI in operations: Leverage 15-60-minute AMI intervals for feeder load models. Recent studies show pathways to reconstruct minute‑level profiles from AMI using data‑driven methods for improved real‑time estimation.
Conclusion
Fundamentals of distribution engineering remain the basis for today’s decisions, but the operating context has changed. LinDistFlow relations still connect feeder physics to planning analyses; ANSI C84.1 provides durable voltage targets; IEEE 1547‑2018 defines DER capabilities that shift both steady‑state and dynamic behavior.
What is new is the scale, variability, and controllability at the grid edge—and the data now available to characterize it. Practical programs pair hosting‑capacity workflows with smart‑inverter settings, evaluate EV impacts through transformer thermal aging metrics, and close observability gaps with μPMUs, line sensors, and AMI‑enabled analytics.
Utilities that apply these methods and measurements enable feeders to productively integrate higher levels of DER and transportation load while maintaining protection performance and voltage quality.