Facebook
 Google
 GitHub
 Linkedin
Development of a Wideband High-Precision Current Sensor
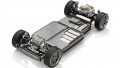
In the field of power electronics, especially within the automotive and railway segments, the miniaturization and heightened efficiency of inverters that
In the field of power electronics, especially within the automotive and railway segments, the miniaturization and heightened efficiency of inverters that represent the primary structural component of motor drive systems is one of the most important tasks for developers. Wideband gap power semiconductors such as SiC and GaN are expected to feature smaller passive components due to higher switching frequencies and lower loss due to low ON-resistance, thus leading to their use.
The switching frequency of inverters built with power semiconductors will continue to heighten, which will necessitate power measurement at even wider bandwidths and higher precision. This article discusses the key features of a recently developed wideband high-precision current sensor and provides performance comparisons with competing products.
Classification of Current Sensors by Principle of Operation
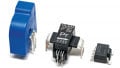
Table 1 shows HIOKI’s current sensor products classified into six operation principles. The Hioki CT6904 represents the fluxgate element type.

Table 1. Current sensors classified by operating principle.
High Precision Power Measurement Using the Current Sensor Method
In order to achieve high precision power measurement with high repeatability using the current sensor method, it is important to use the following standards as conditions for selecting the appropriate current sensor [1].
(1) The rated current of the current sensor matches the current level of the DUT.
(2) The DUT’s switching frequency of the current and all of the frequency components including harmonics are within the measurable frequency bandwidth of the current sensor.
(3) Measurement accuracy of the current sensor is defined across its entire measurable frequency bandwidth, and that the accuracy is sufficiently high.
(4) Uncertainty with respect to the current sensor’s output noise, temperature characteristics, the effect of conductor position, the effect of external magnetic fields, magnetic susceptibility, the effect of common-mode voltage, etc., are clearly defined and sufficiently small.
In particular, it is important to note that with regard to condition (3), many general current sensors define accuracy solely for DC and 50/60Hz signals, while accuracy for all other frequencies is only stated for typical reference. When using the current sensor method to measure power with high precision, careful attention must be paid to select both a power analyzer [2] and the current sensor that exhibit the appropriate performance levels.
Developing a Wide Bandwidth, High Precision Current Sensor for Next-Generation Power Electronics
Over a span of more than 40 years, HIOKI has developed high-performance current sensors using proprietary technologies [3]. Its most recent development is the CT6904 AC/DC Current Sensor that delivers even higher performance in order to meet the needs of next-generation power electronics applications. Table 2 provides the key specifications of the CT6904 (800A).
A) New CT Coil Structure
Figure 2 illustrates the new CT coil structure of the newly developed Opposed Split Coil Technology. That technology increases the measurement band for current by utilizing a split winding in an opposed arrangement around a magnetic core. By optimizing the coil winding, the parasitic capacitance between wires is reduced and the frequency characteristic is improved.
B) Circuit Architecture
Figure 3 shows the architecture of the CT6904 AC/DC current sensors. Like conventional products (e.g., Hioki CT6862), the instrument uses the flux gate method, which takes advantage of the nonlinearity of a magnetic material’s B-H characteristics to detect magnetic fields. This method, which offers high sensitivity and extremely high-temperature stability, is generally used to detect direction based on terrestrial magnetism.

Table 2. Key Specifications of CT6904 (800A).

Figure 1. Frequency Derating Characteristics.

Figure 2. CT Coil Structure
[Solid Shield] Aluminum shield machined into a unique shape to eliminate the influence on current measurements.
An excitation current (f = 10.4 kHz) consisting of a triangle wave is generated so as to saturate a magnetic core around which a feedback coil is wrapped. When the current to be measured flows under these conditions, the instrument performs differential detection of changes in the voltage waveform induced in the winding by the resulting magnetic flux. By performing synchronous detection of this detection signal using a 2f signal that is synchronized with the excitation current, it is possible to obtain an output signal that is generally proportional to the current being measured. However, because the flux gate suffers from degraded sensitivity in the presence of large magnetic fields that cause its magnetic core to become saturated, we incorporate a design known as the zero-flux method by adding a negative feedback circuit. This enhancement allows the instrument to measure large currents.

Figure 3. Circuit Architecture
C) Block Diagram
Figure 4 provides a block diagram. To achieve the instrument’s basic current measurement accuracy, which significantly exceeds that of conventional sensors, we reduced noise by carefully selecting the magnetic material and optimizing the design of the fluxgate excitation circuit’s filter. Furthermore, stability was improved by adopting new electronic components with excellent temperature characteristics and long-term stability for use in the output block’s differential circuit.

Figure 4. Block Diagram
D) Shield Structure
Figure 5 shows the shield structure of the CT6904. By completely shielding the opposed split coil with a uniquely shaped solid shield crafted from aluminum, we are able to achieve both broad bandwidth and superior noise resistance. That allows accurate measurement without influence from surrounding voltage.

Figure 5. Shield Structure
Example Characteristics
Figure 6 through 14 illustrates the CT6904’s example typical characteristics. The instrument delivers extremely favorable characteristics compared to conventional products or competing products, including in terms of frequency characteristics (versus gain and phase), CMRR, and effect of conductor position.
A) Frequency Characteristics
Figure 6 shows an example of its frequency characteristics. By utilizing a new CT coil structure in a closed-loop current sensor in which feedback current is made to flow to a feedback winding so as to continuously zero out the magnetic field generated by the current under measurement, we were able to achieve a wide 4MHz frequency bandwidth.

Figure 6. An example of frequency characteristics.
The phase values appearing in Figure 6 illustrate the difference when the HIOKI PW6001 Power Analyzer’s phase shift function is activated. The phase shift function of the current sensor will be described below. High-accuracy current sensors tend to exhibit a phase error component that increases gradually in proportion to the frequency in the high-frequency portion of the frequency domain, with the result that measurement accuracy may deteriorate for high-frequency measurement targets with a low power factor. The PW6001’s phase characteristics shift block performs proprietary signal processing in real time to correct the phase characteristics of the 5 MS/s current waveform.
Current sensor phase characteristics information is configured by entering values for frequency and phase error from the sensor’s test results. The instrument determines time lag, which is calculated from the input frequency and phase difference and performs processing to shift to the equivalent time. This approach makes it possible to perform optimal correction for HIOKI’s various current sensors based on each sensor’s characteristics [4].
B) Performance Comparisons with Competing Products
The frequency characteristics graphs in Figure 7 and Figure 8 provide a comparison of the gain and phase uncertainties between the CT6904 and the HIOKI 9709 (500 A rated current, 100 kHz frequency bandwidth), Competitor A (600 A rated current, 500 kHz frequency bandwidth), and Competitor B (600 A rated current, 300 kHz frequency bandwidth), respectively.

Figure 7. Frequency characteristics comparison of gain uncertainties.

Figure 8. Frequency characteristics comparison of phase uncertainties.
Because the competing sensors are both current output sensors, I-V conversion via a wideband shunt resistor is required. The frequency characteristics were measured using an FRA (Frequency Response Analyzer). As shown in the comparison results, the CT6904 exhibits extremely superior flatness up to 1 MHz over its competitors. ([Phase Shift Points] CT6904: 300 kHz; 9709: 20kHz; Competitor A: 100 kHz; Competitor B: 10 kHz)
C) CMRR and Superior Noise Resistance
Figure 9 shows the frequency characteristics with respect to the common mode rejection ratio (CMRR). By completely shielding the opposed split coil with a solid shield crafted from aluminum, we were able to achieve exceptionally wide measurement bandwidth and noise resistance. For example, the sensor delivers a CMRR of 120 dB (1/1 million) at 100 kHz, enabling it to measure accurately with low susceptibility to surrounding electric fields. Compared with traditional pass-through current sensors, it provides superior CMRR of at least 40 dB (1/100).

Figure 9. Frequency characteristics with respect to CMRR.
In order to prove its high noise immunity, an experiment was conducted with the configuration shown in Figure 10, and an example of the measurement result is shown in Figure 11. In Figure 11, the uppermost yellow waveform is a voltage waveform, and the other four waveforms are three-phase output current waveforms. From the results, it was clear that the CT6904 exhibits significantly less noise than competitors A and B. For reference, the characteristics of HIOKI PW9100 are also shown. PW9100 is a direct-wiring type current sensor [5].

Figure 10. Experimental configuration for noise resistance comparison.

Figure 11. Results of comparison of noise resistance.
D) Measurement Repeatability Not Affected by Conductor Position
Figure 12 illustrates conductor position on the inner core (A to F: position). Figure 13 and Figure 14 compare the effects of conductor position of the CT6904 with those of competitor sensors A and B. As illustrated, the CT6904 delivers superior gain and phase characteristics for input current at 100kHz.

Figure 12. Conductor position on the inner core.

Figure 13. Effect of conductor position (gain).

Figure 14. Effect of conductor position (phase).
Performance Required for High-precision Measurement of High-frequency Reactors
Inductance is the principal component in determining a reactor’s impedance. From a power measurement standpoint, the measurement is characterized by a low power factor. In short, the phase difference between the voltage and the current is close to 90°. As illustrated in Figure 15, the effect of the phase error between the instrument’s voltage and current measurement system on measured values is greater than when the measurement is carried out with a high power factor. Consequently, the measurement system must exhibit a high degree of phase precision.

Figure 15. Relationship between phase error and active power error at different power factors.
In addition, reactors are switched at frequencies ranging from several tens of kHz to several hundreds of kHz. As described above, commercialization of SiC and GaN elements has resulted in a tendency toward rising switching frequencies, and it is necessary to use measuring instruments with high phase precision at such high frequencies. Furthermore, when using current sensors, it is necessary to consider the current sensor’s phase error.
Moreover, for measurements such as reactor loss of a step-up chopper circuit in a DC/DC converter, when testing voltage and current, a large common-mode voltage will be generated. As a result, it is necessary to use an instrument with a high CMRR. In addition, conventional wisdom holds that measuring reactor loss is a difficult process because it requires an instrument that exhibits a high level of performance in numerous areas. These requirements can be met by using the PW6001.
Example Applications
A) High-Precision and Efficiency Testing of Inverters
Figure 16 provides an experimental configuration on how to measure the efficiency of the inverter-driven motor, and how the PW6001 and current sensors are configured. Principal components of inverter output power include a fundamental frequency component (up to 2 kHz), its harmonic components, the switching frequency (5 kHz to 100 kHz), and its harmonic components. Of those, the fundamental frequency component is dominant. Figure 17 illustrates an inverter output’s line voltage waveform, line current waveform, and associated FFT results for a typical motor drive system.

Figure 16. Experimental configuration on measuring an inverter-driven motor.
Looking at the voltage FFT results, it is possible to observe the fundamental wave that is the principal component of the line voltage PWM waveform and its harmonics, along with the switching frequency and its harmonic components. A spectrum of at least 0.1 % f.s. exists up to approximately 2 MHz.
The fundamental wave, its harmonics, the switching frequency, and its harmonic components can also be observed for the current waveform. However, the observed spectrum at frequencies of 100 kHz and above falls below 0.1 % f.s., and the current level falls abruptly as the frequency increases. This phenomenon can be explained by considering the equivalent circuit of a motor that is connected to an inverter as a load. The motor’s winding can be thought of as an R-L load consisting of a resistance and inductance connected in series. Consequently, impedance grows at high frequencies, making it harder for current to flow.
Similarly, if we look at the power factor (cos θ) for the power of an R-L load, the power factor approaches a value of 1 when the frequency is low, for example for the fundamental wave and its harmonics. However, inductive reactance becomes dominant at high frequencies such as the switching frequency and its harmonics, so current exhibits lagging phase, resulting in a low power factor.
The bottom half of Figure 18 provides an enlarged view of the time axis for the inverter output voltage and current waveforms up to the switching frequency region. The voltage waveform is triangular. It is apparent that their phase relationship is characterized by the current’s lagging phase, as described above, resulting in a low power factor.

Figure 17. Waveform and FFT results.

Figure 18. Enlarged view of inverter output waveforms.
The characteristics of the main components of the active power of the inverter output are summarized as shown in Figure 19.

Figure 19. Principal components of inverter output active power and their characteristics.
B) Reactor/Transformer Loss Analysis
Figure 20 provides an experimental configuration on how to measure the reactor loss of a step-up chopper circuit in a DC/DC converter, and how the PW6001 and current sensors are configured. Voltage and current applied to the reactor are directly measured by the PW6001, and power and loss are calculated. Power measured using this method represents the sum of the power consumption of the reactor coil and core, making it possible to measure the loss of the entire reactor [6].

Figure 20. Experimental configuration on measuring the reactor loss of a step-up chopper circuit in a DC/DC converter.
Figure 21 shows an example of measuring the voltage and current waveforms of a reactor when it is switching at 100 kHz. Current waveforms measured using traditional current sensors (9709 or Competitor B) may be superimposed with high-frequency common-mode voltage noise at the time of the switching, but with the CT9604, such common-mode voltage noise does not appear, resulting in the ability to see exceptionally clear triangular current waveforms.
Conventionally, in order to maximize the bandwidth, we use an LC resonance phenomenon near 100 kHz, which gives rise to the oscillating signal and common- mode noise. In contrast, the sufficient margin in the 4MHz bandwidth of the CT9604 and excellent noise resistance of at least CMRR=120dB are extremely effective in avoiding this issue without the need for a filter.

Figure 21. Example of measuring the switching waveforms of a reactor (100kHz switching frequency).
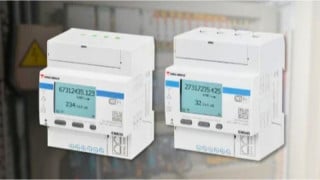
Finally, the configuration images of PW6001 and CT6904 are shown in Figure 22. In addition to the application of this paper, our products are expected to be useful for solving many customer problems.

Figure 22. PW6001 and CT6904.
Conclusion
This article discussed the development of a current sensor that bears pioneering performance capabilities and its usefulness. As an applica tion example, the loss measurement of a DC/DC converter reactor was described. Traditionally, it has been extremely difficult to measure reactor loss with high precision, but using the PW6001 and the current sensor, high precision testing can now be easily achieved. In the power electronics field, frequencies will continue to increase, along with the need to perform high precision analysis of power efficiency and other factors. HIOKI is confident in our ability to contribute to the development of industrial society through the development of advanced measuring instruments [7].
References
[1] H. Yoda, H. Kobayashi, and S. Takiguchi, “Current Measurement Methods that Deliver High Precision Power Analysis in the Field of Power Electronics,” Bodo’s Power Systems, pp.38-42, April 2016.
[2] H. Kondo, C. Yamaura, Y. Saito and H. Kobayashi, “Effectiveness of Phase Correction When Evaluating High-Efficiency Motor Drive”, Bodo’s Power Systems, pp.44-49, November 2017.
[3] K. Ikeda and H. Masuda, “High-precision, Wideband, High Stable Current Sensing Technology”, Bodo’s Power Systems, pp.22-28, July 2016.
[4] H. Yoda, “Power Analyzer PW6001”, HIOKI Technical Notes, Vol. 2, No. 1, 2016.
[5] H. Yoda, “AC/DC Current Box PW9100”, HIOKI Technical Notes, Vol. 3, No. 1, 2017.
[6] K. Hayashi, “Measurement of Loss in High-Frequency Reactors”, Bodo’s Power Systems, pp.18-22, February 2017.
[7] Masayuki Harano, Hajime Yoda, Kenichi Seki, Kazunobu Hayashi, Tetsuya Komiyama and Shuhei Yamada, “Development of a Wideband High-Precision Current Sensor for Next Generation Power Electronics Applications”, in Energy Conversion Congress and Exposition (ECCE), 2018 IEEE, pp. 3565-3571.
About the Authors
Masayuki Harano is a Sensor Product Manager at Hioki E.E. Corporation in Japan. Hajime Yoda is Lead Researcher at HIOKI. Kenichi Seki is Asst. Engineering Manager at Hioki. Kazunobu Hayashi is a Lead Engineer at HIOKI. Tetsuya Komiyama is an Engineer at HIOKI. Shuhei Yamada is a Lead Engineer at HIOKI.