Facebook
 Google
 GitHub
 Linkedin
Advanced Inductor Circuit Models
In this article, Dr. Ridley describes new advanced circuit models that can be used to accurately predict the performance of off-the-shelf inductors. This allows the designer to rapidly assess power supply inductor losses by using standard circuit simulation packages.
Over the past ten years, magnetics manufacturers have made great progress in providing power designers with standard magnetics at reasonable prices. After product development, the main focus of the technical teams is developing comprehensive application test results. These results are provided in custom programs, demonstrating the losses with different operating conditions of voltage and frequency.
Off-The-Shelf Inductors
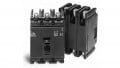
Figure 1 shows the example inductor we will be discussing in this article. It is a helical foil inductor from Coilcraft, rated for use up to about 20 A. A lot of time and effort has been spent to provide detailed loss characteristics for the component, which can be found interactively by using their DC-DC optimizer program [1].
This data is tremendously useful to a power designer. It’s an important step in providing detailed circuit models that are verifiable with test data.

Figure 1. Coilcraft Inductor with Helical Foil Windings. Image used courtesy of Bodo’s Power Systems [PDF]
Buck Converter Circuit With Basic Inductor Model
Figure 2 shows a buck converter application with the inductor in place. Notice the basic circuit model for the inductor includes just the dc resistance and the fixed inductor value. The dc resistance value will provide a very low estimate of the inductor dissipation. There are two ways to assess the performance of the inductor. From the designer’s point of view, the most convenient way would be to run an LTspice simulation and just click on the inductor component to see the loss during the simulation. This is what we can do with every other component in the schematic, and it has become a standard for every component except the magnetics.

Figure 2. Buck Converter Circuit with Coilcraft Inductor DC Parameters. Image used courtesy of Bodo’s Power Systems [PDF]
The other way to assess the inductor performance is to use the customized tools developed by the manufacturer of a component for the operating point of the converter. For the inductor being used here, extensive data has been collected, and this can be seen by running the Coilcraft DC-DC optimizer program [1]. Figure 3 shows the graph of this data for different operating points of the buck converter. The graph on the left is for 200 kHz operation with the input voltage varied from 80 V to 130 V. (Output is 24 V at 10 A).

Figure 3. LTspice Simulation Results for DC Inductor Loss Plotted versus Coilcraft DC-DC Optimizer. Image used courtesy of Bodo’s Power Systems [PDF]
You can see from the left-hand graph how the losses increase with input voltage on the data provided by the Coilcraft DC-DC optimizer. The red curve shows the losses predicted straight from the simulation of the circuit in LTspice. With the DC model, the predicted losses are very low, and there is minimal variation with input voltage.
On the right-hand graph, the input voltage is fixed at 130 V (highest dissipation voltage), and the frequency varies from 100 kHz to 300 kHz. At low frequencies, the losses increase substantially. Ripple currents are higher, and flux excursions in the core are higher. This is not intuitively obvious since you will often read papers claiming that magnetics losses will increase with frequency, not decrease.
While the data is available for the inductor losses through the software from Coilcraft, this is not exactly convenient for the designer. Imagine what a chore it would be if every component of the circuit required a custom program from the vendor to assess its losses. In the semiconductor world, you cannot sell a part unless it has a reasonably accurate simulation model. This expectation has not been applied to the magnetics. There are many reasons for this, but it does not need to be that way.
Advanced Inductor Model in Buck Converter Circuit
Figure 4 shows a much more advanced simulation model for the inductor. In addition to the series DC resistance, you can see a block labeled Rac. The resistance of the windings increases with frequency due to proximity losses. There is also a block representing the core loss of the inductor. This is very specific to the core material, number of turns used, and the core dimensions.
All of the parameters of the ac resistance and the core loss model were derived with the help of RidleyWorks design software [2]. These are described later in this article.
Figure 5 compares the data produced by an LTspice simulation of the advanced model with the measured manufacturer’s data. The deviation between measured and simulated is very small. This is exactly what the circuit designer wants – a straightforward model that predicts the losses from the simulation, just like every other component in the circuit. Once the designer has a trusted circuit model, it’s no longer necessary to use customized software to get the needed results. You can also put the circuit model in any topology you like, with arbitrary circuit waveforms, and expect to get reliable results.

Figure 4. Advanced Inductor Model in Buck Converter Schematic. Image used courtesy of Bodo’s Power Systems [PDF]

Figure 5. LTspice Simulation Results for Advanced Inductor Model Loss Plotted versus Coilcraft DC-DC Optimizer. Image used courtesy of Bodo’s Power Systems [PDF]
Winding Proximity Loss Model
There are two elements needed to match the total losses in the inductor. The first is the winding loss which should be frequency dependent. This is achieved with the circuit diagram shown in Figure 6, which is comprised of five inductors and five resistors. The circuit values are chosen automatically by RidleyWorks to match the desired ac resistance characteristics.
At dc, all the inductors of the network are short circuits, and the only resistance left is Rdc. The inductors become higher impedances with increased frequency, sequentially increasing the resistance of the network. This type of circuit was first proposed for magnetics winding modeling in [4] and has been used for many years by a few select researchers. It is the basis of the circuit models generated by RidleyWorks. We don’t see any usage of this by magnetics manufacturers yet.

Figure 6. Winding Loss Circuit Model for the Coilcraft Inductor. Image used courtesy of Bodo’s Power Systems [PDF]
Advanced Core Loss Model
The second element needed to provide accurate simulation data is a good core loss model. You will find many attempts in the literature to solve the problem of core loss simulation, but none of them have become mainstream.
Figure 7 shows the circuit model derived by RidleyWorks for the sample Coilcraft inductor. This is a set of six parallel R-L branches driven by the voltage across the inductor. A dependent voltage source is used to model the nonlinear exponent of core loss with amplitude, while the R-L branches model the proper frequency dependence.

Figure 7. Core Loss Circuit Model for the Coilcraft Inductor. Image used courtesy of Bodo’s Power Systems [PDF]
This circuit will provide the needed characteristics – the resistor value decreases with frequency showing the highest core loss at the lowest frequency. Further explanation of this model will be included in the next installment of this article.
Advanced Circuit Model Summary
It is reasonable to expect that you can have an accurate simulation model for inductors, which will give the power designer exactly what is needed – losses found directly from the simulation that correspond closely with actual measured results. We have shown that for a specific inductor, this can be done reliably and with relatively little effort. We hope that the inductor manufacturers will start providing users with these kinds of accurate and advanced models to speed up the design process for working engineers.
References
You can read more information on this topic in each of these references.
1. Coilcraft DC-DC Optimizer software https://www.coilcraft.com/en-us/tools/ dc-dc-optimizer
2. RidleyWorks design software https://www.ridleyengineering.com/softwareridley/ridleyworks/ridleyworks-software.html
3. Measurement of Rac using the RidleyBox https://www.ridleyengineering.com/hardware/ridleybox
4. Francisco de Leon, Adam Semlyen, ”TIME DOMAIN MODELING OF EDDY CURRENT EFFECTS FOR TRANSFORMER TRANSIENTS” IEEE Transactions on Power Delivery, Vol. 8, No. 1, January 1993. https://tspace.library.utoronto.ca/bitstream/1807/9972/1/Semlyen_9842_2827.pdf
5. Join 6000+ engineers in our Power Supply Design Center Group on Facebook. https://www.facebook.com/groups/ridleyengineering/
This article originally appeared in Bodo’s Power Systems [PDF] magazine
Featured image used courtesy of Adobe Stock