Facebook
 Google
 GitHub
 Linkedin
Fuel Gauging Part III: Using the Equivalent Circuit Model
Part 3 of this series explains the equivalent circuit approach to fuel gauging and how it enables computing the state of charge and state of health across varying operating conditions when used in tandem with a lookup table.
Part 1 of this series demonstrated that the 2R2C model retained the most fidelity among equivalent circuit models while not unreasonably increasing the computational complexity in predicting the battery’s state-of-charge (SOC) and state-of-health (SOH).

Image used courtesy of Adobe Stock
Equivalent Circuit Model
The equivalent circuit of the model is illustrated in Figure 1.
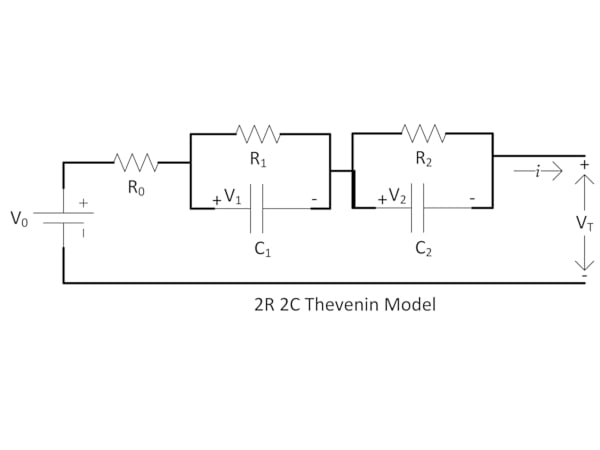
Figure 1. 2R2C Thevenin Model. Image used courtesy of Qorvo
In the 2R2C model, R0 is the ohmic resistance, while R1 and C1 model the polarization resistance and capacitance. The added R2 and C2 components help model the voltage transient behavior and charge diffusion during charging and discharging.
The equations for this model are:
\[V_{T}=V_{0}-iR_{0}-V_{1}-V_{2}(1)\]
where V1 and V2 are voltages across R1C1 and R2C2
\[V^{'}_{1}=\frac{V_{1}}{R_{1}C_{1}}+\frac{i}{C_{1}}(2)\]
\[V^{'}_{2}=\frac{V_{2}}{R_{2}C_{2}}+\frac{i}{C_{2}}(3)\]
The time domain equation for this model is derived as
\[V_{T}=V_{0}+iR_{1}\Big(1-e^{\frac{-t}{\tau_{1}}}\Big)+iR_{2}(1-e^{\frac{-t}{\tau_{2}}})(4)\]
where
\[\tau_{1}=R_{1}C_{1}\,and\,\tau_{2}=R_{2}C_{2}\,and\,\tau_{1}>\tau_{2}(5)\]
These time domain equations can be solved using Laplace transforms. Once solved, a further transformation into difference equations can be applied to develop linear coefficients across the entire battery charge-discharge cycle.
With experimental data obtained from cycling, it is possible to model the following:
1. R1, the electrolyte resistance from ionic concentration and its change due to temperature
2. R2, the electrode resistance, modeling its thermal coefficients and its change across temperature
3. C1, the double layer capacitance due to polarization at the electrode-electrolyte interface and its temperature dependence
4. C2, the diffusion capacitance due to the concentration gradient that occurs from
5. movement of charge across the battery
Modeling the OCV Profile
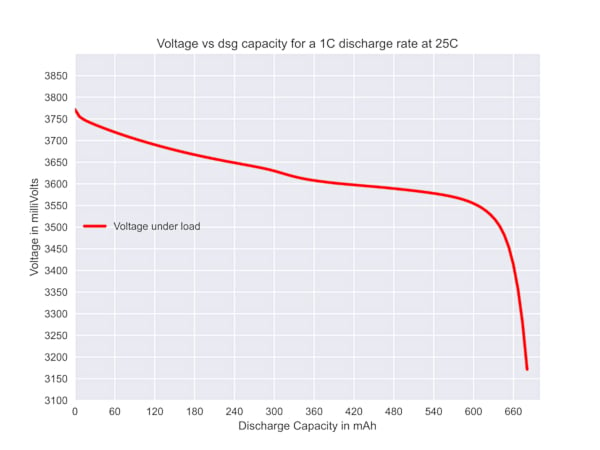
Figure 2. Voltage against the discharge capacity as the cell is discharged. Image used courtesy of Qorvo
Examining the discharge curve of a Li-ion battery at room temperature of 25°C, it is evident the curve is non-linear. Dividing the curve into three zones:
1. A high state of charge between 100% to 60%
2. A middle state of charge between 60% and 20%
3. A lower state of charge region between 20% and 0%
At high states of charge, the voltage change rate per unit decrease in the state of charge is much higher than the middle portion of the curve. A similar effect is seen at the lower state of charge. Unlike the above two regions, the middle region remains rather flat.
Therefore, calculating the R1, R2, C1, and C2 values from a single point of reference will not provide good accuracy over the entire usable voltage range of the battery. In addition, as the battery ages, the non-linearity is further amplified, causing unacceptable error levels in RSOC prediction.
The discharge curve can be subdivided into piecewise linear regions to counteract this. The number of piecewise linear subdivisions depends upon the battery chemistry and the accuracy required by the application. Each distinct region has its own slope and initial and terminal points. The regions can be defined by specifying the slope variance as less than a predetermined value. For each specific region, the characteristic parameters are calculated from experimental data.
Initially, an estimate of the total discharge capacity of the battery is obtained by discharging the battery at C/100 with periodic relaxation or rest intervals to stabilize the battery voltage. Once this discharge profile is obtained, the discharge curve can be segmented into regions of equal passed charge bound by an upper and a lower voltage. With this data, a skeleton of a lookup table can be established. Since the discharge rate is very low, and rest intervals punctuate each discharge at both ends, the voltage profile can be considered the equivalent of the open circuit voltage or the OCV of the battery.
Region Modeling and Load Profiles
Once the discharge profile has been subdivided into suitable regions, the characteristic parameters can be calculated from the voltage equations 1-5 specified above. With this, the resistances and capacitances for each region can be determined. Depending on the hardware’s computational capabilities for gauging, these can be solved as time-domain or difference equations. When this procedure is completed across the entire discharge curve, the values obtained are the battery pack’s characteristic parameters. These parameters are typically derived at a predefined nominal rate, C/5. Once characterized, these parameters can be applied to all cells or battery packs produced from the same process and assembly line.
While initial battery pack characterization is done at specific rates, during usage, the battery can be discharged at any rate within the safe operating region described by the manufacturer. The usable battery capacity depends on the discharge rate or the load. It is usually less than the rated battery capacity under nominal conditions, as shown in Figure 3.
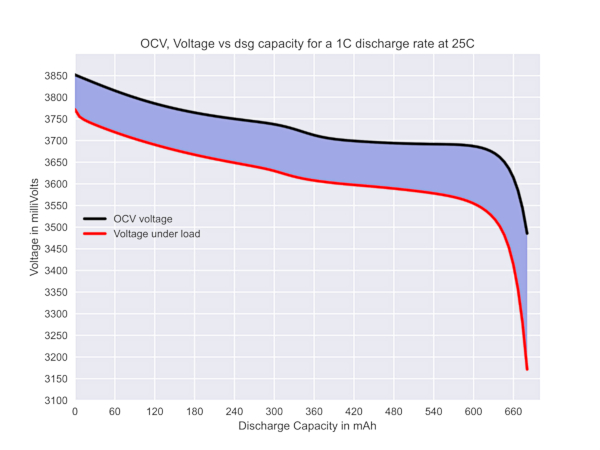
Figure 3. OCV and the loaded voltage under a 1C discharge profile. Image used courtesy of Qorvo
The black curve represents the battery's OCV curve when discharged at a 1C rate. The second curve in red represents the loaded voltage, and the region under the curve between the X and Y axes represents the usable battery capacity under the specified load. This capacity is less than the capacity seen under the OCV curve.
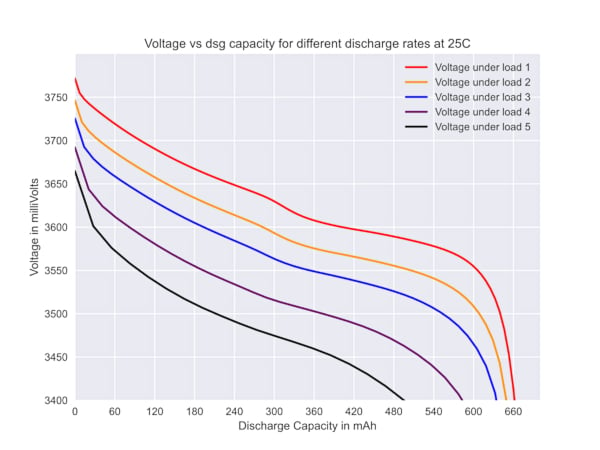
Figure 4. Rate dependence of discharge capacity. Image used courtesy of Qorvo
Figure 4 illustrates this rate dependence of discharge capacity for an application with a minimum system voltage of 3400 mV. As the load rates increase from loads 1-5, the discharge capacity reduces from 660 mAh to about 500 mAh. Another compensation parameter should be applied to calculate the full charge capacity or FCC under a given load for greater accuracy. This can be obtained when the initial characterization is expanded to include rates higher and lower than the nominal discharge rate. If the nominal discharge is C/5, then additional lower rates, such as C/7 and C/10, and higher rates, such as C/2 and C or even 3C/2 or 2C, can be used depending on the battery datasheet specifications. A good SOC accuracy can be obtained using curve fitting techniques and interpolation at all rates within the battery specification.
Temperature and Aging
Batteries derive power from reversible chemical reactions. Since chemical reactions are affected by the ambient temperature, the usable capacity exhibits temperature dependence. Figure 5 shows how temperature can affect battery capacity.
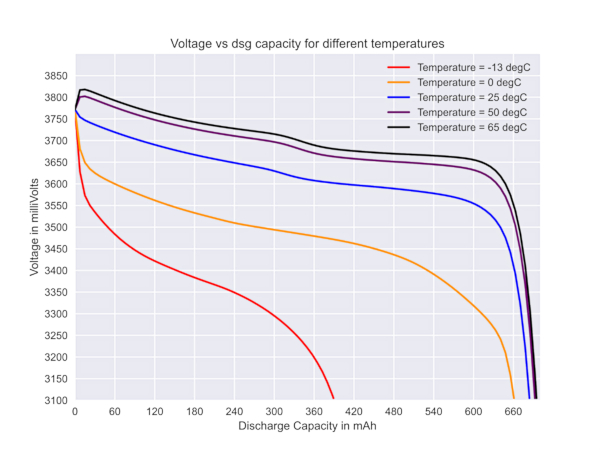
Figure 5. Temperature dependence of discharge capacity. Image used courtesy of Qorvo
As illustrated in Figure 5, the usable battery capacity decreases at lower temperatures, while at higher temperatures, the capacity slightly increases. This is because the thermodynamic rate-dependent reactions between the electrode and electrolyte slow down at lower temperatures and increase somewhat at higher temperatures. Therefore, to deliver the same amount of power at lower temperatures, the battery must overcome a higher internal resistance and expends energy overcoming it, causing a reduction in capacity. At temperatures higher than room temperature, this internal resistance reduces. Therefore, a greater capacity for the application is available from the same battery.
This influences battery capacity by moving the OCV at any given state of charge or depth of discharge. Since a piecewise linear approach was used to develop the battery model, this temperature effect on OCV and capacity can be modeled to use local extrema for a fast-moving stochastic and a slow-moving stochastic across the entire SOC range. The data points for developing these parameters can be obtained by cycling the battery at various ambient temperatures within the manufacturer-specified operating regions. Interpolation can be used to adapt the coefficients for operating temperatures at which characterization has not been performed.
Aging is another factor that influences capacity. As the battery is charged and discharged, the chemical reactions and physical processes cause material degradation in the electrodes and the electrolyte. This reduces the amount of reactive material leveraged to produce or store energy. The ratio of nominal available capacity at any time (Qt) over the nominal available capacity of an unused new battery (Qt=0) is the state of health.
\[SOH=\frac{Q_{t}}{Q_{t=0}}\]
The lookup table with piecewise linearization to measure the change in the RC parameters of the battery in combination with tracking passed charge using coulomb counting allows two different methods to measure the state of health as a battery age.
Other Considerations
In addition to the algorithm used, fuel gauging accuracy depends on the hardware used to take real-world physical measurements. It is important to have ADCs with good resolution, noise margin, error rates, and sampling intervals to take quick and accurate measurements. The ADCs also need to measure voltage and current simultaneously or within milliseconds of each other to avoid a skew in the measurements that can affect accuracy. Temperature measurements should be performed at the cell pack and the system level to develop a detailed input profile for thermal modeling. Sufficient consideration should also be given to the safe operating region.
Lithium batteries, under unsafe operating conditions, can undergo rapid thermal runaway. These are uncontrollable, self-sustaining reactions that can cause grievous harm. Thresholds for overvoltage, undervoltage, overcharging, over-discharging, overcurrent, short-circuit, overtemperature, and under-temperature should be monitored to prevent excursions from the SOA. When all else fails, fuses, relays, PTCs, TCOs, secondary protectors, and other cut-off elements must be utilized to reduce risk to life, environment, and property.
Qorvo’s power application controller battery management systems (PAC-BMS) product line has more than 80 years of combined expertise with an expanding portfolio of products. The PAC22140 and PAC25140 feature ARM Cortex processors with an advanced battery analog front end that can charge, gauge, monitor, and protect 10-20s battery packs. Modular API-based and production-ready advanced firmware with Class-B safety libraries and functional safety-capable architecture, supporting multiple development environments such as Keil, IAR, and Eclipse, is also available. Qorvo’s portfolio roadmap is expanding to include multiple customizable solutions.