Facebook
 Google
 GitHub
 Linkedin
Advanced Inductor Circuit Models: Finding the AC Resistance
This article describes how to obtain the proper AC resistance of the inductor winding.
This article is published by EE Power as part of an exclusive digital content partnership with Bodo’s Power Systems.
This article on advanced inductor modeling describes how to obtain the proper AC resistance of the inductor winding. The final accurate circuit model of the inductor was found by making lab measurements of the AC resistance, which incorporates all loss mechanisms. Proximity analysis alone does not show all the measured losses.
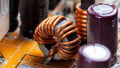
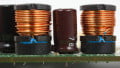
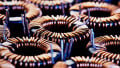
Inductor Circuit
Models Figure 1 shows the inductor we want to model: a Coilcraft part constructed with helical foil windings. There are four circuit model variations shown in this Figure. Model 1 is built from the data given by the manufacturer with DC resistance and inductor value. This is the extent of modeling used by most designers. After running a circuit simulation, the inductor losses are analyzed separately rather than being dependent upon the simulation results for loss. Model 2 includes the ac resistance of the winding using proximity loss analysis. At high frequencies, most of the current flows on the inner part of the winding, and much of the copper is unused. This leads to a considerable increase in resistance. We will see in this article that the predicted losses still fall short of the observed results.
Model 3 adds a circuit to calculate core losses in the inductor during the simulation dynamically. This model is built from measured core loss data for the given material. (Details of this core loss model are presented in detail in Part I of this article.) This core model will show other losses depending on the waveforms applied to the inductor. It is not solely dependent on the ac flux swing of the inductor core. Standard analysis techniques would not show this dependence.
Finally, Model 4 relies on the actual measurement of the ac resistance. The size will include the proximity loss effects and the increased resistance due to fringing fields around the gap of the inductor core. The fringing loss is very significant for this particular inductor as the windings are close to the core gap.
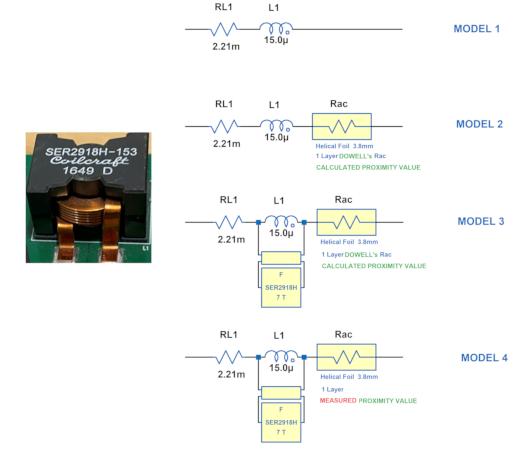
Figure 1. Helical winding inductor with four different circuit models. Image used courtesy of Bodo’s Power Systems [PDF]
Figure 2 shows the predicted loss of the first three circuit models obtained by running LTspice simulations. The DC circuit model predicts the lowest loss, and this data is shown in red. It indicates a 10x smaller dissipation than the Coilcraft DC-DC [1] optimizer software predicted. Model 1 is not going to give us satisfactory results.
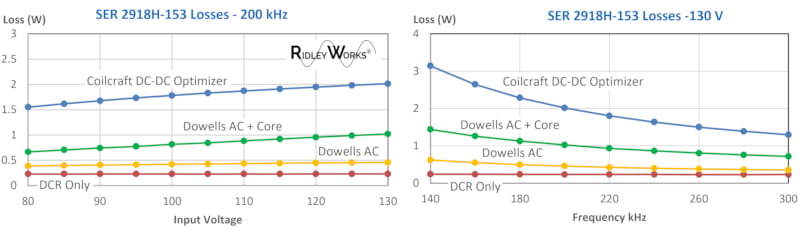
Figure 2. Real Inductor Losses Compared to Simulations with Models 1-3. Image used courtesy of Bodo’s Power Systems [PDF]
Adding the results of Dowell’s equation solutions [2] for the foil shows increased losses, but there is still poor agreement with the predicted results. When the core loss is added, as shown in the green curve, we approach about 50% of the actual loss. This model is also not adequate for predicting the behavior of the inductor.
Manufacturer Winding Resistance Data
The core loss predictions have been proven to work well over the years. The quantity that remains uncertain is the AC winding resistance. Many factors affect the AC resistance, including the concentrated fields seen around the gap of the core.
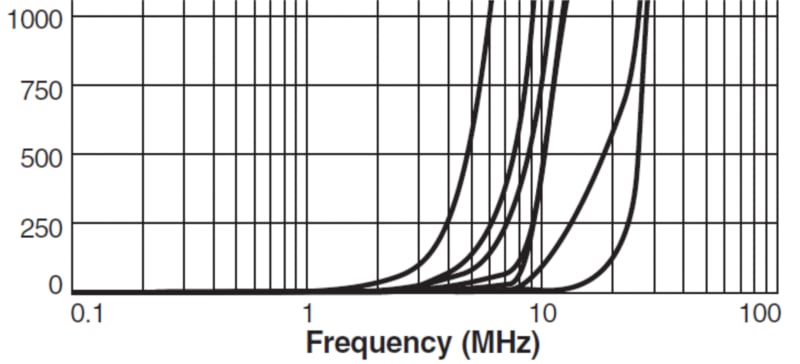
Figure 3. AC resistance measurement provided by the manufacturer. Image used courtesy of Bodo’s Power Systems [PDF]
Manufacturers may give AC winding resistance in their datasheets, but our experience is that this is a very unreliable measurement. Figure 3 shows it is impossible to resolve the data on the graph given for the specific part we are analyzing. You cannot extract any useful information in the 200 kHz region since the resistance is plotted as a linear quantity rather than logarithmic. We will have to find this data ourselves to build a good model.
Measuring Winding Resistance Accurately
Magnetic winding resistance is one of the more challenging measurements to make. For current inductors like the one under consideration in this article, the DC resistance is very low–in the order of 2 mΩ. This low value must be extracted from impedance sweeps on an inductor with a substantial inductive component. That presents the first challenge for the measurement instrument. Secondly, the low resistance will be smaller than the connector resistance, so we must use a setup that eliminates contact resistance from the measurement.
We prefer to use a Kelvin-connection test fixture to eliminate the connection error. The setup is shown in Figure 4 with the AP Instruments AP300 analyzer. Notice the input to Channel B of the analyzer is connected directly to the foil exit leads of the inductor. This prevents us from measuring the contact resistance of the terminals. A wideband injection transformer is part of the measurement setup to allow us to connect this way.
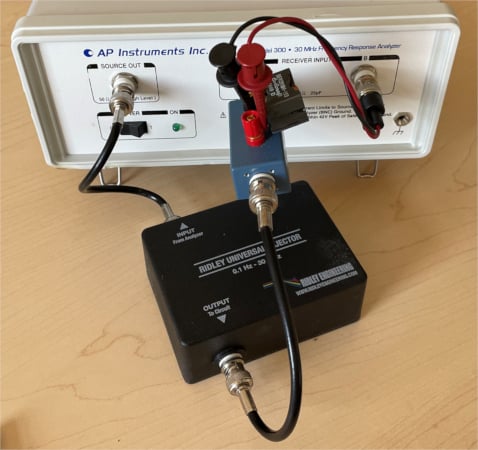
Figure 4. Measuring inductor RAC using AP300 analyzer. Image used courtesy of Bodo’s Power Systems [PDF]
Figure 5 shows the raw impedance measurement from the analyzer. In our experience, the measurements always deviate from the real value due to resonances and parasitics of the inductor and test setup. In this case, you can see the upward curve of the size at 250 kHz.
Our years of experience in magnetics characteristics lets us make an intelligent projection of what the actual RAC measurement should be.
We know that the AC resistance will have a straight line (logarithmic) characteristic at higher frequencies, and we can usually approximate this slope from the lower-frequency part of the curve where measurements are accurate. With experience in proximity loss characteristics plotted on a logarithmic scale, an intuition develops on the approximation for reliable models. For most devices, we see classic Dowell’s equation characteristics that are immediately recognizable by experienced magnetics design engineers.
The dashed purple curve shows the presumed value of ac resistance, which will be used to build the proper model for the inductor. This curve has an interesting slope of +20 dB/decade. If we were experiencing just proximity loss in the windings, we would expect the final asymptote to be 10 dB/decade as the resistance would climb by the square root of the frequency.
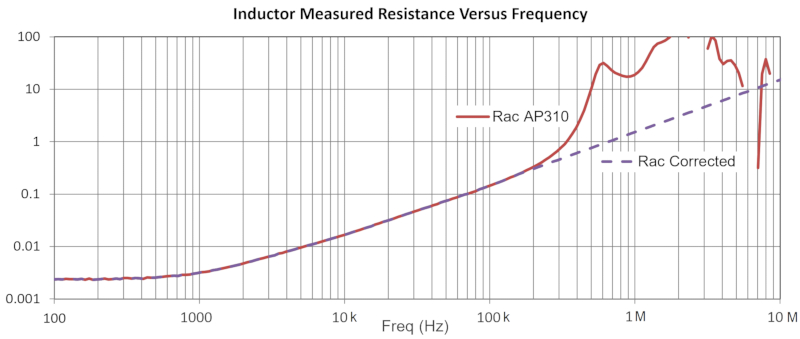
Figure 5. Measured AC resistance – raw data and extrapolated measurement. Image used courtesy of Bodo’s Power Systems [PDF]
Three different plots of resistance are shown in Figure 6. Firstly, we have the DC resistance, a fixed value at just above two mOhm. We have the solution to Dowell’s equation for the flat foil winding in red. The resistance increases significantly even at 1 kHz. Despite this substantial increase, it was not enough to account for the losses in the inductor.
Finally, the RAC in green is plotted in Figure 6. This is the extrapolated value from Figure 5. This data fits a circuit model with the model generation fully automated in RidleyWorks. The 5th-order R-L network provides an excellent match to the actual measurement of ac resistance. With the values shown, this R-L network is the equivalent circuit used for Model 4 of Figure 1.
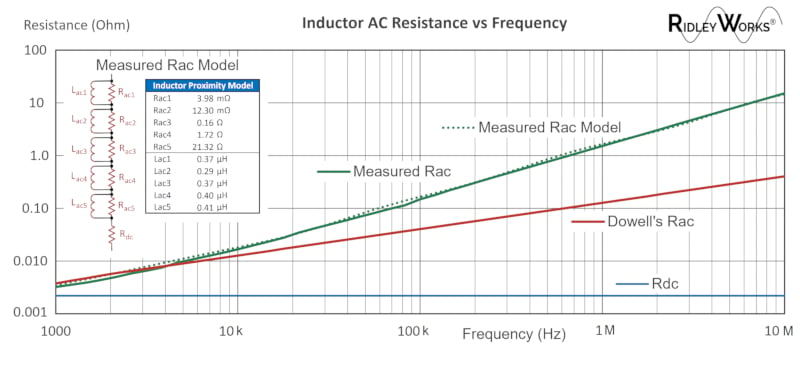
Figure 6. Different winding resistance values with circuit model for the measured rac. Image used courtesy of Bodo’s Power Systems [PDF]
Core Gap Is the Source of Increased AC Resistance
The additional loss in the circuit comes from this inductor being constructed with the core gap positioned in the center of the windings. A gap of about 0.5 mm was measured in the core structure, and the windings are just a few tenths of an mm away from the gap.
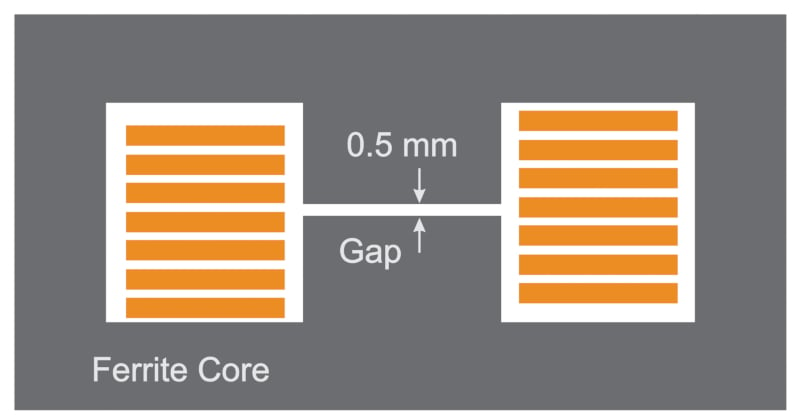
Figure 7. Fringing fields from the core gap explain the resistance increase. Image used courtesy of Bodo’s Power Systems [PDF]
Measuring these quantities for the inductor is difficult without breaking things apart. And, of course, you can’t see the gap anymore when you do that. However, we persevered by sacrificing a few parts and confirmed the anticipated gap size with RidleyWorks software.
Some researchers like to use Maxwell or other finite-element modeling software to find the fringing losses around the gap. It’s not an easy problem to set up since the spacing of the copper from the gap varies as you progress around the core. It’s much quicker to measure the ac resistance than trying to use complex software.
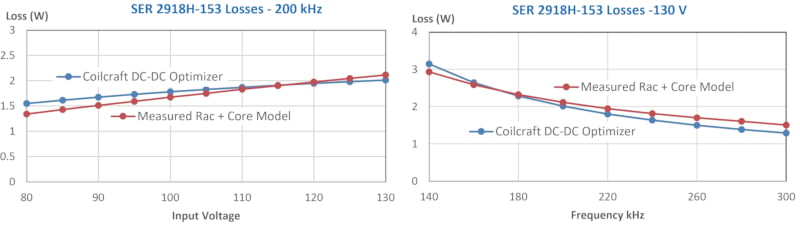
Figure 8. The final simulated circuit model using measured RAC tracks experimental loss data closely. Image used courtesy of Bodo’s Power Systems [PDF]
The results of the model that uses the measured ac resistance are presented in Figure 8. Now we see close agreement between the estimated losses and the LTspice predictions. Engineers can depend on the circuit simulation to give them the losses in the inductor with a good degree of accuracy.
AC Resistance Summary
It is quite straightforward to develop good simulation models for inductors. We estimate that it takes about 2 hours to generate a model for each part. A combination of analytical tools found in RidleyWorks, and measurements of ac resistance lets us build the core loss and winding loss components of the inductors. Including the increase in ac resistance due to the fringing losses was essential for this example.
Now the magnetic components behave like every other circuit element in the simulation, and we can see the losses directly from a circuit simulation. If we can persuade magnetics manufacturers to provide these models, design engineering will become much more productive.
References
You can read more information on this topic in these references.
1. Advanced Inductor Modeling Dr. Ray Ridley and Mr. Art Nace, May 2023 Bodo’s Power Magazine.
2. RidleyWorks design software.
3. Measurement of ac resistance using the AP310 Frequency Response Analyzer.
4. Francisco de Leon, Adam Semlyen, ”TIME DOMAIN MODELING OF EDDY CURRENT EFFECTS FOR TRANSFORMER TRANSIENTS” IEEE Transactions on Power Delivery, Vol. 8, No. 1, January 1993.
5. Join 6400+ engineers on Facebook in our Power Supply Design Center Group.
6. Find detailed inductor losses for certain topologies: Coilcraft DC-DC Optimizer software.
This article originally appeared in Bodo’s Power Systems [PDF] magazine