Facebook
 Google
 GitHub
 Linkedin
Using the Calorimetric Method to Verify Dynamic Power Device Analyzer Switching Energy Calculations
Knowing the power dissipation of a transistor is important to calculate the overall efficiency of the system and dimension the transistor’s cooling system. Wide-bandgap (WBG) semiconductors drastically increase switching frequencies (f), making switching energy (ES) a key contributor to the total power dissipation (P). Extracting ES is not trivial and multiple methods exist. The calorimetric test allows a comparison of these extraction methods to determine which fits best. The Keysight PD1500A Dynamic Power Device Analyzer is well suited for characterizing ES.
Losses in Silicon Carbide (SiC) Semiconductors
A transistor in forward conduction has three loss components – switching loss (PS), conduction loss (PC) and gate-drive loss (PG). PG is generated by charging and discharging the transistor’s input capacitance through the internal gate resistor. Gate charge (QG) can be measured for various test conditions with the PD1500A. An effective gate capacitance can be calculated from the gate voltage swing and QG, to obtain an estimate of PG. In general, PG is comparatively small and therefore ignored in this article. PC is determined by the internal drain-source resistance (RDS), drain current (ID) and duty cycle (D). ID and D are input parameters to the test setup. RDS can be measured very accurately for silicon (Si) and SiC transistors using Keysight’s B1506A Power Device Analyzer. PS is the product of ES – consisting of the turn-on energy (Eon) and the turn-off energy (Eoff) – and ƒ. The PD1500A is used to measure ES.
The market share of WBG semiconductors is steadily increasing and ƒ in the hundreds of kilohertz range is not uncommon. The contribution of PS to P increases with increasing ƒ. At the same time, RDS (and thus PC) is drastically reduced using SiC transistors. Therefore, PS plays an increasingly important role. This increases the priority to measure ES compared to Si IGBT based systems.
Extraction of ES with PD1500A
Of the two relevant losses of SiC transistors, PS is generally the more difficult parameter to characterize accurately. Depending on the type of transistor, IGBT or FET, there are different definitions by International Electrotechnical Commission (IEC). The device for our test is a discrete SiC FET, so IEC 60747-8 is the basis for the extraction algorithm. To extract the switching energy, the product of ID and drain-source voltage (VDS) is integrated for a specific time interval. The start and endpoints of the integration are the times at which the two waveforms pass through 10% of test voltage and test current respectively. [1]
The definition for IGBTs in IEC 60747-9 is different and leads to much larger integration times. They start at 10% VGE (gate-emitter voltage) or 90% VGE transit for turn-on and turn-off respectively and end at 2% VCC (supply voltage) or 2% IC (collector current). Therefore, IGBT extraction is expected to result in larger calculated switching energies compared to FET extraction. [2]
Switching fast is advantageous to achieve low losses. Thus, there is typically large ringing on the voltage and current waveforms during switching, causing problems with determining the integration endpoint per the IEC definitions, see Figure 1. There are a few ways to interpret the standard. For example, the first or last ‘10% transition’ of VDS or ID caused by the ringing could be used for the integration endpoints, leading to different results. There is also the possibility of not following the FET standard at all. As a reference, the IGBT standard is also calculated using the last transitions, see Table 1. As expected, this leads to the highest calculated ES in our reference measurement.
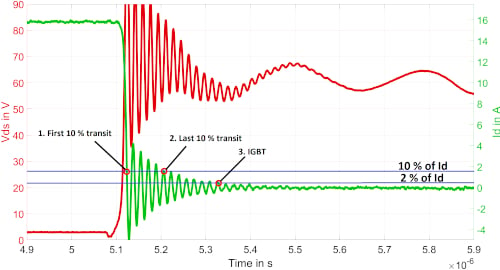
Figure 1. Turn-off transition for a fast-switching transistor showing ringing in current (green) and voltage (red). Image used courtesy of Bodo’s Power Systems
| 1: First 10 % transit | 2: Last 10 % transit | 3: IGBT definitions, last transit | |||
| Eon | Eoff | Eon | Eoff | Eon | Eoff |
| 0.7 µJ | 7.1 µJ | 0.7 µJ | 16.1 µJ | 1.3 µJ | 23.8 µJ |
| ES | ES | ES | |||
| 7.8 µJ | 16.8 µJ | 25.1 µJ | |||
Table 1. Calculated switching energies for a 3.3 Ω resistor at 60 V using three extraction methods.
Using a Calorimeter to Verify ES
To verify the switching energies determined with the PD1500A, a calorimetric test is performed. Calorimeters can be used to measure P in a semiconductor by measuring its self-heating. Since there is an instrument to measure each of the relevant losses separately, PC can be subtracted and only PS can be monitored.
The chosen calorimeter is a self-made metal block calorimeter, see Figure 2. For the measurements, the PD1500A is modified so it can be used with the calorimeter. With these modifications, only low voltage tests can be performed because the available power supply with enough current capability could only supply 60 V. The behavior of the calorimeter itself is characterized by dissipating a constant power in the body diode of the transistor and measuring its heating curve. Varying the total power dissipated in the transistor case results in different heating curves with characteristic temperature gradients, see Figure 3. The measurements can be used as a reference as the heating behavior is the same whether the power is dissipated by the body diode or by the transistor on the chip. In addition, pulsed power dissipation in the kilohertz range can be treated the same as constant power dissipation due to the inertia (τ ≈ 3 · 103 s) of the metal block of the calorimeter.
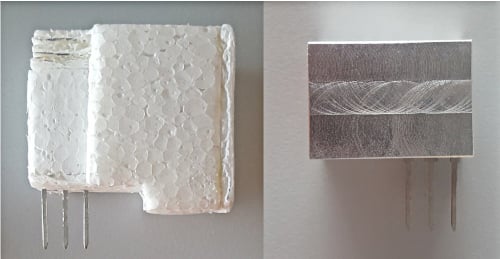
Figure 2. TO-247 transistor inside the self-made calorimeter with and without insulation. Image used courtesy of Bodo’s Power Systems
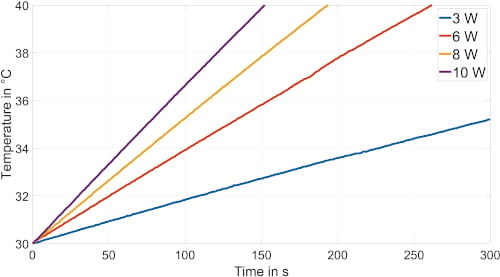
Figure 3. Heating curves of calorimeter. Image used courtesy of Bodo’s Power Systems
The load for our calorimeter measurement is a resistor and not the coil normally used in the PD1500A. On the one hand, this facilitates the calculation of PC since ID is constant during the pulses. On the other hand, the reference measurement of PS must also be performed with a resistor because of the different switching loci of load resistors and load inductors, see Figure 4.
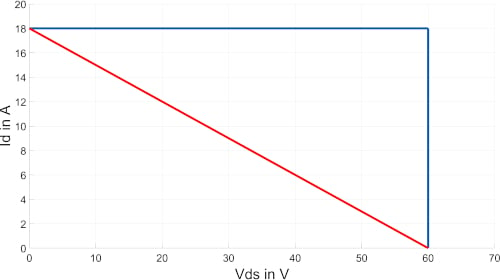
Figure 4. Idealized switching locus for a load inductor (blue) and load resistor (red). Image used courtesy of Bodo’s Power Systems
The schematic for both the reference extraction and calorimetric measurement can be seen in Figure 5. For the calorimetric test, a 3.3 Ω resistor is switched at 60 V, 75 kHz, and a duty cycle of 10 %. Using a lookup table (Table 2), P can be estimated by comparing the temperature rise for different time segments with the body diode reference measurements.
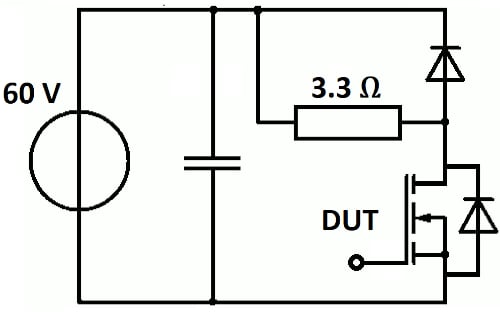
Figure 5. Schematic for the calorimetric test and the switching energy extraction test. Image used courtesy of Bodo’s Power Systems
The results show that the actual P is slightly less than 3.5 W. As mentioned before, P mainly consists of PC and PS. The measurement of the B1506A shows that the expected PC of the selected transistor is 1.9 W leaving 1.6 W for PS. Since ƒ is low, D is kept small to ensure that PC is not too dominant. The extracted PS is 0.6 W, 1.3 W or 1.9 W depending on the extraction method. This shows that the actual PS of 1.6 W lies in between methods 2 and 3 of measuring ES.
| 3 W reference | 3.5 W reference | 4 W reference | Measurement | |
| ΔT0s-15s | 1.05 K | 1.22 K | 1.39 K | 1.2 K |
| ΔT15s-30s | 1.00 K | 1.19 K | 1.38 K | 1.19 K |
| ΔT30s-45s | 1.01 K | 1.18 K | 1.36 K | 1.16 K |
| ΔT45s-60s | 0.98 K | 1.16 K | 1.35 K | 1.15 K |
| ΔT60s-75s | 0.98 K | 1.15 K | 1.33 K | 1.11 K |
| ΔT75s-90s | 0.96 K | 1.13 K | 1.29 K | 1.11 K |
Table 2. Lookup table with heating gradients.
Conclusion
Higher f result in a higher contribution of PS to P. As the market share of WBG semiconductors increases, the correct characterization of PS is more important than ever. The information can be used to quantify the overall efficiency, but also to properly design the device’s cooling system. We showed the PD1500A’s extraction algorithms can be used to properly estimate ES8 for specific test conditions. In doing so, it is advantageous to look for the last transit rather than the first transit to determine the integration end time. As for the cooling system, a slight overestimation of the losses is generally better than underestimation. With the PD1500A, the user has the option to use both IGBT and FET extraction methods. To learn more about Keysight’s PD1500A Dynamic Power Device Analyzer, please visit our website (www.keysight.com/find/PD1500A) or contact your local Keysight representative.
References
[1] IEC 60747-8 Field-effect transistors.
[2] IEC 60747-9 Insulated-gate bipolar transistors (IGBTs).
This article originally appeared in Bodo’s Power Systems magazine.