Facebook
 Google
 GitHub
 Linkedin
PWM Inverter Power Measurement System Required for Evaluating the Efficiency of Advanced Motor Drive Systems
This article highlights Hioki E.E. Corporation PWM Inverter power measurement system for performance evaluation of high efficiency motor drive systems.
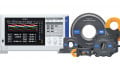
Measuring power accurately in the inverter switching frequency and its harmonic frequency domain is critical in order to properly evaluate the performance of high efficiency motor drive systems. A power measurement system combining the Hioki Power Analyzer PW6001 that delivers superior performance and a phase shift function with newly developed Hioki AC/DC Current Sensors CT6875 / CT6876 / CT6877 can lead to accurate efficiency evaluation of such systems.
Foreword
In recent years, against the backdrop of efforts to stem global warming, motor drive systems used for electric vehicles and industrial applications have drawn much attention, and their increasing efficiency has advanced. In the power conversion efficiency and loss evaluation of inverters and motors, which are the key components of motor drive systems, accurate power measurement is critical, and calls for extremely precise current sensors and power analyzers [1]. However, PWM output power includes the switching frequency and its harmonic components in addition to the AC frequency component for driving the motor, making it difficult to accurately measure the power at this switching frequency and its harmonic frequency range. Indeed, to date, there has been no complete system that can accurately measure PWM inverter power.
In this article, we will first show the specifications of a power measurement system required to accurately measure the PWM power of an inverter, focusing on the features of the PWM waveform, and clarify the problems that a power measurement system faces. Next, in order to solve these problems, the extremely superior performance of newly developed current sensors is introduced together with a phase shift technology provided by a power analyzer. Finally, the actual measurement results of the PWM power of an SiC inverter will illustrate the singular effectiveness of this new power measurement system.
Characteristics of PWM Inverter Waveforms [2]
The principal components of inverter output power include a fundamental frequency component (up to 2 kHz), its harmonic components, the switching frequency (5 kHz to 100 kHz), and its harmonic components. Of those, the fundamental frequency component is dominant. Figure 1 illustrates an inverter output’s line voltage waveform, line current waveform, and associated FFT results for a typical motor drive system. Table 1 provides detailed information about the measurement target.
Looking at the voltage FFT results, it is possible to observe the fundamental wave that is the principal component of the line voltage PWM waveform and its harmonics, along with the switching frequency and its harmonic components. A spectrum of at least 0.1% f.s. exists up to approximately 2 MHz.
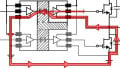
The fundamental wave, its harmonics, the switching frequency, and its harmonic components can also be observed for the current waveform. However, the observed spectrum at frequencies of 100 kHz and above falls below 0.1% f.s., and the current level falls abruptly as the frequency increases. This phenomenon can be explained by considering the equivalent circuit of a motor that is connected to an inverter as a load (Figure 2). The motor’s winding can be thought of as an R-L load consisting of a resistance and inductance connected in series. Consequently, impedance increases at high frequencies, making it harder for current to flow.
Similarly, if we look at the power factor (cos θ) for the power of an R-L load, the power factor approaches a value of 1 when the frequency is low, for example, for the fundamental wave and its harmonics. However, because inductive reactance becomes dominant at high frequencies such as the switching frequency and its harmonics, current exhibits lagging phase, resulting in a low power factor.
The bottom half of Figure 3 provides an enlarged view of the time axis for the PWM inverter output voltage and current waveforms up to the switching frequency region. The voltage waveform is rectangular, while the current waveform is triangular. It is apparent that their phase relationship is characterized by the current’s lagging phase, as described above, resulting in a low power factor.
Figure 4 shows the principal components and characteristics of the active power of a PWM inverter output.

Figure 1: Waveform and FFT results for an inverter-driven motor (measured with Hioki Power Analyzer PW6001)

Table 1: Measurement target specifications

Figure 2: Motor equivalent circuit (for 1 phase)

Figure 3: Enlarged view of inverter output waveforms

Figure 4: Principal components and characteristics of a PWM inverter’s active power
Performance Required for High Precision Measurement of PWM Inverter Power
This section describes the requirements that a power measuring instrument must satisfy in order to accurately measure PWM inverter power. Based on the characteristics described above, it is important that such an instrument be capable of measuring active power not only for a high-power-factor fundamental wave and its harmonics, but also for a low-power-factor switching frequency and its harmonic components.
Figure 5 illustrates the relationship between phase error and active power error at different power factors. Voltage and current phase error in the measurement circuit has a greater effect on active power at low power factors than at high power factors. Consequently, accurate measurement of active power at the switching frequency and its harmonic components requires both flat amplitude characteristics and flat phase characteristics across a broad frequency band, the latter being particularly important. For power components that consist of a rectangular-wave voltage and triangular-wave current as shown in Figure 3, the frequency band across which the instrument must exhibit flat amplitude and phase characteristics in order to measure efficiency at a precision of 0.1% is likely 5 to 7 times the switching frequency [3].
Suppose that the switching frequency of an IGBT inverter is operated at 10 kHz, the flat amplitude and phase band required to measure the entire PWM inverter power with 0.1% accuracy is approximately 50 to 70 kHz. On the other hand, supposing that the switching frequency of an SiC inverter is operated at 100 kHz, the flat amplitude and phase are required to be around 500 to 700 kHz.

Figure 5: Relationship between phase error and active power error at different power factors
Issues Faced by a Power Measurement System
The indicator for evaluating flat amplitude and phase performance is the active power frequency characteristics at zero power factor of the power analyzer. Figure 6 shows examples of the active power frequency characteristics at zero power factor of a general power analyzer and the Hioki Power Analyzer PW6001. From Figure 6, in the example of a general power analyzer, even if the measured device is an IGBT inverter, you can see that the analyzer’s performance is insufficient to accurately measure the switching frequency and the power of its harmonic components. On the other hand, the Hioki PW6001 has flat characteristics up to 1 MHz, and you can see that both IGBT and SiC PWM inverter power can be accurately measured. Thus, the active power frequency characteristics at zero power factor is an indicator for evaluating the measurement performance of PWM inverter power.
Next, Figure 7 shows an example of the amplitude and phase-frequency characteristics of a conventional 500A rated (DC to 100 kHz) pass-through current sensor. In general, current sensors tend to have increased phase error in high frequency regions due to the characteristics of the sensor’s magnetic core and circuit. As mentioned earlier, to measure PWM power accurately, flat amplitude and phase charac-teristics are required in the frequency band up to about 5 to 7 times the switching frequency. In the example of the current sensor shown in Figure 7, even if the measured device is an IGBT inverter, you can see that the performance is insufficient to accurately measure the switching frequency and the power of its harmonic components.

Figure 6: Example of active power frequency characteristics of the PW6001 Power Analyzer at zero power factor

Figure 7: Example amplitude and phase frequency characteristics of a conventional pass-through current sensor

Table 2: Main specifications of newly developed current sensors
Furthermore, in a high frequency switching environment with switching elements, common mode noise tends to be superimposed on the current sensor via the measured device. As an example, in the current waveform zoomed in on the time axis shown in the lower part of Figure 3, high frequency noise synchronized with the switching timing of the voltage is superimposed on the current waveform.
When measuring PWM inverter power, the frequency characteristics of these current sensors and the effects of common mode noise are the main factors that cause measurement accuracy of the active power of the switching frequency and its harmonic components, which have a low power factor, to deteriorate. For this reason, in a PWM inverter power measurement system combining a conventional current sensor and a power analyzer, the effects of measurement er-ror of the switching frequency and its harmonic component are much larger than the effects of measurement error of the fundamental wave and its harmonic component. For this reason, we need to resolve the issue of not being able to accurately measure PWM inverter power.

Figure 8: Operating principle of zero flux method using fluxgate element
A Newly Developed Current Sensor and Phase Shift Technology
To solve this problem, Hioki developed three types of AC/DC current sensors with a rated current of 500A, 1000A, and 2000A (Table 2). All of the sensors use the zero flux method with the fluxgate element. Fig. 8 shows the principle of operation. Highly accurate measurement is performed by supplying a feedback current to the feedback winding (closed loop) so that the magnetic flux generated in the magnetic core is canceled by the alternating current flowing in the measured conductor. A newly developed opposed split coil (coil in which divided wind-ings are arranged opposite each other on a magnetic core to broaden the range of current detection) was adopted as the sensor, and a wide band was realized. In addition, a shield layer was formed inside the case to improve CMRR (Common Mode Rejection Ratio).

Figure 9: Example amplitude and phase frequency characteristics of the newly developed Hioki CT6875
Based on the above technology, the newly developed sensors bear the following distinctive features:
- Wide measurement bandwidth exceeding 1MHz
- Superior linearity that maintains high precision even down to low levels
- High CMRR at wide bandwidths, with almost no effects from common mode noise
- Excellent temperature characteristics that helps achieve high long-term stability
Figure 9 shows an example of the frequency characteristics of the Hioki CT6875 AC/DC Current Sensor rated at 500A. The phase of the frequency characteristics example represents the characteristics when using the current sensor phase shift function [2] available on Hioki Power Analyzer PW6001, in addition to the individual characteristics of the CT6875. When using the phase shift function, we set the phase characteristics value specific to the current sensor in the PW6001 in advance. As a result, the PW6001 measures power in real time while computing phase shift according to the set value. By combining the newly developed current sensor and the PW6001’s built-in current sensor phase shift function, it is possible to improve the phase characteristics in the high frequency range at each stage as part of the power measurement system.
Figure 10 shows an example of the CMRR characteristics of the CT6875. CMRR is dramatically improved via the shield inside the sensor case. This can prevent high frequency common mode noise from being superimposed on the current waveform.

Figure 10: CMRR-Frequency Characteristics of the CT6875
Through the improved performance of these current sensors, PWM inverter power can be measured accurately by pairing them with the PW6001.
Comparison of Actual Measurement Results of PWM Inverter Power
Using the SiC inverter shown in Table 1 above, we measured and compared the PWM power measured using the PW6001 in combination with the three newly developed current sensors and a conventional pass-through current sensor. The motor’s rotational speed and load torque are constant, and the inverter switching frequency is measured under each operating condition of 10kHz to 200kHz. The

Figure 11: Sensor comparison when measuring PWM inverter power

Figure 12: Sensor comparison of the fundamental wave component of PWM inverter power

Figure 13: Comparison of the current waveforms of PWM inverter output
newly developed current sensors are properly performing under the phase shift settings on the PW6001.
The power measurement results are shown in Figure 11. The new sensors showed almost identical measurement results for all three models at any switching frequency. On the other hand, for the conventional pass-through current sensor, the difference between the measured value and those obtained with the new sensors becomes larger as the switching frequency becomes higher.
On the other hand, Figure 12 shows the comparison of the fundamental power measurements under the same conditions. The fundamental power measurements were almost identical for all models at any switching frequency.
Furthermore, Figure 13 shows the comparison of a current wave-form of the PWM inverter output under the operating condition of a 100 kHz switching frequency between the newly developed CT6875 and a conventional pass-through current sensor. Despite measuring the same object, CT6875 achieves it with low noise. The dramatic improvement of the CMRR characteristics is due to the shield inside the sensor case.
From these results, it can be inferred that the significant deviation shown in Figure 11 between the active power measurement values of the three newly developed current sensors and that obtained by the conventional sensor is attributed to the measurement performance in the frequency band of the switching frequency and its harmonic components (amplitude characteristics, phase characteristics, CMRR characteristics).
Summary
In this article, we illustrated the importance of measuring power accurately in the inverter switching frequency and its harmonic frequency domain in order to properly evaluate the performance of high efficiency motor drive systems. We also provided measurement examples that showed that a power measurement system combining the Hioki Power Analyzer PW6001 that delivers superior performance and a phase shift function with newly developed Hioki AC/DC Current Sensors CT6875/ CT6876/CT6877 can result in accurate efficiency evaluation of high efficiency motor drive systems that has been difficult until now.
References
- A. Yoda, et al.,” Current Measurement Methods that Deliver High Precision Power Analysis in the Field of Power Electronics” Bodo’s Power Systems, April 2016, pp. 38-42.
- H. Kondo, C. Yamaura, Y. Saito and H. Kobayashi,” Effectiveness of Phase Correction When Evaluating High-Efficiency Motor Drive” Bodo’s Power Systems, November 2017, pp. 44-49.
- K. Hayashi,” High-Precision Power Measurement of SiC Inverters” Bodo’s Power Systems, September 2016, pp. 42-47.
This article originally appeared in the Bodo’s Power Systems magazine.
Related Content