Facebook
 Google
 GitHub
 Linkedin
Performance Index-Based Security Assessment and Screening Effect: Part 1
Learn how to conduct performance index-based security assessment in power systems and how the screening effect impacts the accuracy of the assessment.
When something goes wrong in a power system that results in power outages, engineers often revert to tools that can analyze how stressed and secure a power system is to ensure overall stability.
One of the commonly used analysis tools is the Performance Index (PI), which assesses the health of the grid by analyzing voltages and deviations in power flow within the power system. However, these indices can sometimes mask underlying issues, creating a false sense of security within the system.
This concept, better described as the 'Screening Effect', can conceal critical issues necessitating the need for assessing system security for an evaluation that is more accurate and reliable.
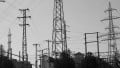
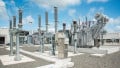
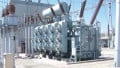
High voltage conductors in a substation. Image used courtesy of Pixabay.
Understanding PI-Based Security Assessment
Performance Index-based security assessment is used for the aggregation of power system’s parameters using indices to assess contingencies and deviations in system variables such as voltage, to maintain safe operating limits and prioritize the corrective action for the detected issue.
One of the common types of performance indices is the voltage performance index (VPI), which assesses the deviation of the system's bus voltage against its allowable limits during contingencies like power outages. VPI identifies poor voltage profiles and voltage instabilities within the power network.
By summing up all values across all the buses (Nb) in a power system, the deviation of the bus voltage (ΔVi) from its reference voltage at bus (i) can be determined as expressed in the formula below. Using the exponent (n), the sensitivity of the index can be adjusted, and the deviation normalized by the maximum allowable voltage (Vi, limit). The PI to assess voltage deviation (PIv) can therefore be expressed as:
$$PI_V = \Sigma_{i=1}^{N_b} ~ \big( \frac{|\Delta V|}{V_{i,i~t}} \big)^{2n}$$
Another type of PI is the line overload index (LOI), which assesses thermal overload in transmission lines resulting from the apparent power flowing through the line (Sj) where (j) is the power line. LOI is important for detecting overloaded paths early before resulting in cascading failures.
To evaluate LOI, the ratio of the apparent power and the thermal limit of the power line is determined to understand how close the power line is to being overloaded. Similar to VPI, the exponent (n) tunes the response sensitivity of the index in LOI.
$$PI_L = \Sigma_{j=1}^{N_l} ~ \big( \frac{S_j}{S_{j,i~t}} \big)^{2n}$$
Use in Contingency Analysis
When it comes to use cases, performance indices work well in contingency analysis, simulating potential grid failures and evaluating their impacts. There are two contingency analysis types, the N-K and the N-1 analysis.
The N-1 contingency analysis evaluates the impact of losing one component from a power system on its overall performance. This component could be a power transformer, a transmission line, or a generator. These components can be power transformers, transmission lines, or generators.
The first process involved in this type of contingency analysis is the simulation of an outage by component withdrawal from the power system. Once this is done, the LOI and VPI are evaluated, and the severity resulting from the withdrawal is assessed. In this case, if the resultant values of the load and voltage indices tend to zero, the power system is secure, and if the values surpass the threshold, the analysis indicates a violation within the system that needs corrective action.
For instance, consider a transformer outage that results in voltage deviation of 2%, 4%, and 6% in three of its buses from its normal voltage level, which is limited to 5%. When the exponent is set to 1, we can evaluate the voltage index as expressed here:
$$PI_V = \big( \frac{0.02}{0.05} \big)^{2} + \big( \frac{0.04}{0.05} \big)^{2} + \big( \frac{0.06}{0.05} \big)^{2} = 2.24$$
The total voltage index value is 2.24, and the third bus alone has a high value of 1.44, signaling insecurity in that particular bus.
N-K contingency analysis assesses outages resulting from the failure of multiple components in a power system. This type of failure is rare, but it is still essential to conduct this type of analysis for resilience planning of aspects like harsh weather conditions or cyberattacks. N-K involves ranking high-risk cases using PIs and conducting probabilistic analysis for proper risk assessment.
For instance, a hurricane can cause an overload of 110 and 130 % to two power transmission lines with a sensitivity exponent of 1. In this case, LOI can be evaluated to assess the stress caused by adverse weather conditions as shown here.
$$PI_L = \big(1.3)^{2} + \big(1.1)^{2} = 1.69 + 1.21 = 2.90$$
The resultant index features a high value that needs immediate redistribution of load. While PIs are efficient assessment tools, they are prone to errors resulting from the screening effect described in the next section of this article.
What is Screening Effect
In the security assessment of power systems, screening effect is when critical issues within the power system are masked when using aggregated performance indices. For instance, a power transmission line might exhibit a problem with one line, characterized by a slight overload, while another line within the same power system has a critical overload that exceeds the recommended limits.
When, now an aggregated LOI is used to assess the issue, the critically affected line might not stand out due to the averaging process of the indices that appears acceptable. This potential cover-up of an issue can lead to the failure of the power operator's algorithm that responds to high-risk contingencies due to false security. In the event of voltage collapse in large systems, averaging can result in localized voltage dips.
Looking at the factors that contribute to the screening effect, the choice of the exponent (n) tops the list as it handles the response aggressiveness in the PI evaluation. A lower exponent (n=1) increases the resistance to detecting large issues. With a flattened response curve, high-risk scenarios are potentially masked by the indices resulting from lower exponent value. In comparison, a higher exponent (n=3), increases the response of the index to critical occurrences, but can sometimes cause numerical instabilities and inaccurate results.
The second factor that causes screening effects is the wrong choice of normalization method. Normalization is used to determine how individual deviations are scaled before being aggregated to one index value. When an average normalization method is used, potential issues might be masked and missed.
The final contributing factor to screening effects is the assigning of similar weight to the power systems component despite featuring different levels of importance. This assumption of equality may simplify calculations of the indices but cause false security by undervaluing high-priority elements within the grid.
Understanding PI for Grid Reliability
Having an overview of some of the factors contributing to screening effects, it is also essential to understand the way in which these factors can be neutralized to prevent instances of false security in power systems. In my next article, “Performance Index-Based Security Assessment and Screening Effect—Part 2”, I cover how screening effects can be mitigated to ensure that the PI values used in the assessment of modern power systems offer reliable metrics to assess dynamic issues within the system.