 Facebook
 Google
 GitHub
 Linkedin
Distribution Transformers—Part 6: Voltage Drops, Quality Standards
This article reviews feeder voltage drop, practical calculation methods, service quality standards in North America and Europe, and planning practices with regulators, capacitors, and DER controls.
Distribution transformers are fundamental to feeder voltage control. Their impedance, tap settings, and interaction with downstream conductors and loads shape the service voltage experienced at the point of delivery and at utilization equipment.
Modern feeders add further complexity: rapidly varying photovoltaic generation, switched capacitor banks, and autonomous DER controls all influence the voltage profile.
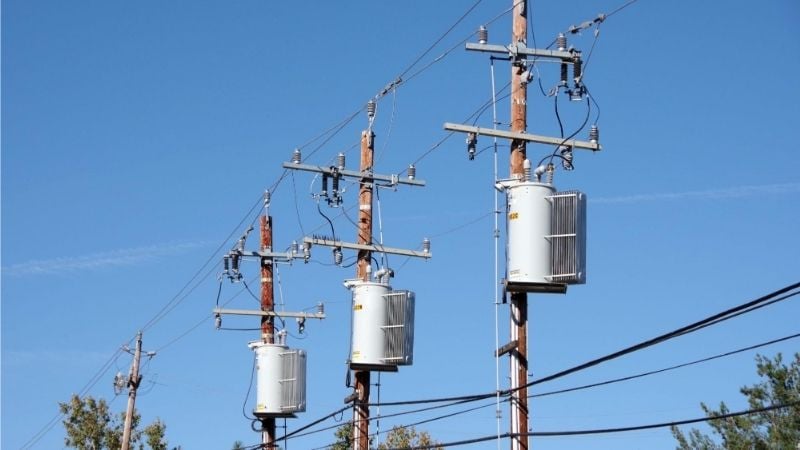
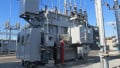
Distribution transformers. Image used courtesy of Adobe Stock
Voltage Drop Calculations and Feeder Performance
In steady-state analysis, the classical “ohmic” drop relation expresses the magnitude of voltage change along an ac feeder section as a function of current and line impedance resolved into resistance and reactance. For a single-phase circuit, a widely used approximation is:
$$V_{drop} = 2I(R\cos \phi + X\sin \phi)$$
For three-phase balanced feeders, the corresponding line-to-line magnitude is:
$$V_{drop,3\phi} = \sqrt{3}I(R\cos \phi + X\sin \phi)$$
with R and X taken over length L.
Voltage regulation is commonly expressed as a percentage between no‑load and full‑load conditions:
$$VR(\%) = \frac{|V_{no\text{-}load}| - |V_{full\text{-}load}|}{|V_{full\text{-}load}|} \times 100$$
This definition is standard across utility and manufacturer design guides.
Single-Phase Vs. Three-Phase Considerations
Single‑phase laterals on three‑phase feeders often serve asymmetric loads. The single‑phase formula above is therefore applied phase‑by‑phase with phase‑specific loading and lateral impedance, while the three‑phase expression serves for balanced mainline estimates.
On three‑phase mainlines, attention to sequence coupling and mutual terms improves accuracy in detailed studies. Practical hand estimates typically proceed with positive‑sequence R and X and the factor as noted.
Factors Affecting the Voltage Profile
Feeder length: Longer primary runs proportionally increase IR and IX drop, especially on rural feeders with small conductor sizes.
Conductor impedance: At lower power factors with inductive loads, the X sinφ term can approach or exceed the R cosφ component, so conductor reactance materially influences voltage change.
Load distribution: Distributed load tends to produce a smoother gradient along the feeder. Large lumped loads near the end can compound local sags. Time-varying DER injections cause the inverse, creating local rises on lightly loaded sections.
Power factor: As φ changes, the balance between resistive and reactive drop changes; low power factor (lagging) increases voltage drop for a given current.
Practical Calculation Methods
Simplified hand calculations: For quick planning checks, engineers use tabulated R and X per unit length with assumed φ (often 0.8–0.95 lagging) in the formulas above, summing segment drops to estimate end-of-line voltage. These methods are consistent with IEC 60364-5-52 Annex G and utility distribution references.
Power flow simulations: For feeders with significant DER, switched capacitors, and regulator interactions, time‑series power flow is preferred. Quasi‑static time series (QSTS) simulations resolve minute‑scale variations of load and PV to capture both voltage rise and regulator/capacitor operations realistically. This approach is widely used in feeder hosting capacity analysis and modern distribution planning studies.
Service Quality Standards (ANSI C84.1 and IEC/EN)
ANSI C84.1 Voltage Ranges (United States)
In the U.S., ANSI C84.1 establishes nominal system voltages and service/ utilization voltage ranges. Two bands are defined: Range A for normal operation and Range B for short‑duration deviations that may occur but should be limited in magnitude and time.
For service voltage at the point of delivery, Range A is typically ±5% of nominal. Range B for utilization voltage commonly spans +5.8% /-13.3% of nominal, recognizing occasional excursions outside Range A at equipment terminals. State utility rules explicitly adopt these limits and their intent.
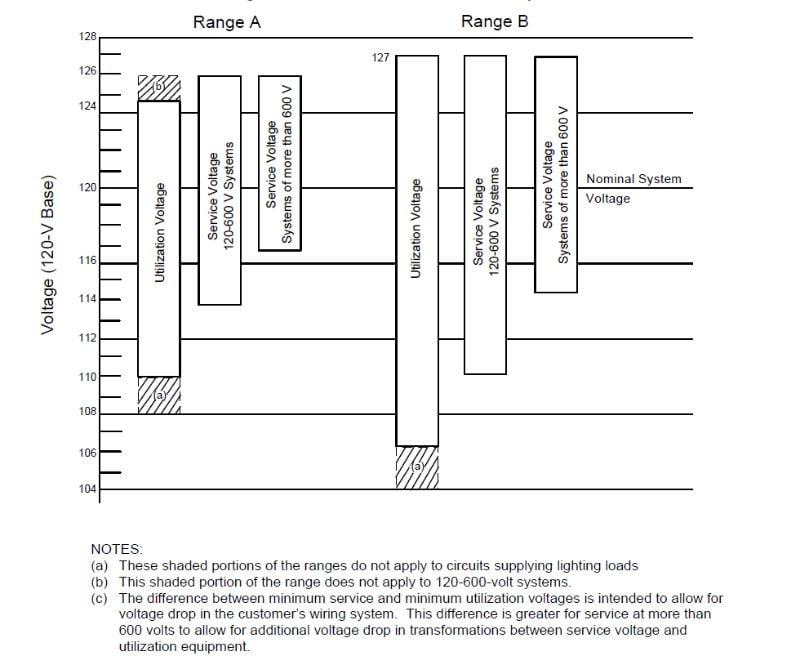
Figure 1. Voltage ranges, ANSI C84.1. Image used courtesy of Voltage Disturbance
IEC Voltage Standards and EN 50160—Europe and International
IEC 60038 specifies standard nominal a.c. voltages (for example, the widely adopted 230/400 V for LV systems), serving as reference values for equipment and system design; it does not set service quality bands.
In Europe, EN 50160 defines voltage characteristics at public distribution supply terminals. Under normal conditions and over one week, 95% of 10‑minute rms values must be within ±10% of the nominal voltage (Un); all 10‑minute rms values must be within +10%/−15% of the Un over the week. This probabilistic approach reflects long‑term service quality at the point of common coupling.
Table 1. Service Quality Standards
| Standard | What It Specifies | Typical Steady-State Objective |
| ANSI C84.1 (NEMA/ANSI) | Nominal voltages and service/utilization voltage ranges (Range A and B) for 60 Hz systems | Range A service voltage ≈ ±5% at the service point; Range B intended for limited duration at utilization voltage (+5.8%/−13.3%) |
| IEC 60038 | Preferred nominal voltages | Nominal reference values only (such as 230/400 V LV) |
| EN 50160 | Voltage characteristics at public supply terminals | 95% of 10-min rms values within ±10% of Un; all values within +10%/−15% over one week |
Utility Planning Practices for Compliance
Maintaining Compliance at Peak Load
High-load periods push feeder currents up, increasing IR and IX drop and lowering end‑of‑line voltage. Common practices include:
Step‑voltage regulators: Line regulators provide approximately ±10% range in 32 steps of about 0.625% per tap, coordinated by line‑drop compensation to reflect feeder R/X and targeted voltage at a “remote” point. Design and testing of step‑voltage regulators are defined in IEEE/IEC C57.15 and IEC 60076‑21.
Switched shunt capacitors: Properly staged capacitor banks reduce reactive current and thus the X sinφ component of voltage drop on inductive feeders. Application guidance, including sizing, staging, transient considerations, and system interactions, is provided in IEEE 1036.
Transformer taps: Fixed LTC positions at substations and fixed taps on distribution transformers are selected to center voltages within the desired band across expected load ranges, with care to coordinate with downstream regulation. General transformer requirements are covered in IEEE C57.12.00 and product‑specific standards such as IEEE C57.12.34 for pad‑mounted units.
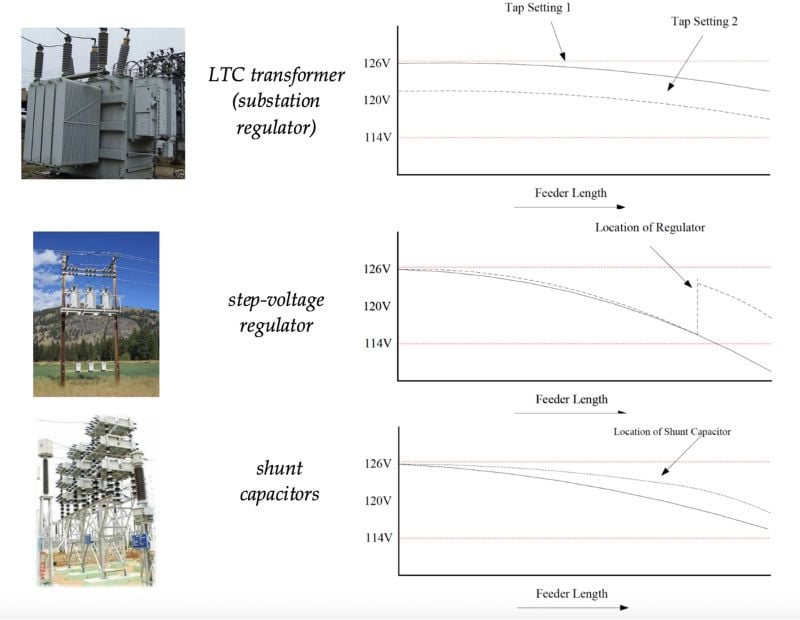
Figure 2. Voltage regulation mechanisms. Image used courtesy of Purdue University
Maintaining Compliance at Light Load/High PV
Light load with high distributed PV can produce voltage rise toward the end of radial feeders, particularly on high‑impedance laterals. Practices include:
Regulator reverse‑power logic and bandwidth settings: Modern regulator controls detect reverse flow to avoid inappropriate boosting during PV backfeed, while preserving acceptable deadbands to limit tap hunting. IEEE/IEC C57.15 provides test and terminology; vendor O&M manuals document practical control modes.
Capacitor control strategy: Voltage‑ or VAR‑based switching, seasonal lockout, and stage size limits help avoid overvoltage during midday PV peaks. IEEE 1036 includes guidance for switching, overvoltage capability, and interactions with other equipment.
DER controls: Interconnection requirements mandate capabilities such as Volt/VAR and Volt/Watt. Properly tuned, these functions absorb reactive power or curtail real power to constrain voltage within service limits while minimizing losses and curtailment. Implementation details and recommended settings ranges are discussed in IEEE 1547-2018.
Practical Calculation and Study Workflow
Screening with hand estimates: Use R and X data for the feeder section, estimate load current at expected power factor, and compute approximate voltage drops. Check voltage regulation (%) against internal planning targets and service limits (such as ANSI C84.1 Range A at the service point). Provide engineering margin for seasonal extremes and daily peaks.
Detailed time‑series studies: For feeders with regulators, capacitors, and DER, perform QSTS simulations over representative days or full years using 1–15‑minute time steps. Models include regulator line‑drop compensation, control deadbands, capacitor switching logic, secondary transformer models, and DER Volt/VAR or Volt/Watt curves per IEEE 1547‑2018. Studies quantify voltage bandwidth, tap operations, capacitor switching counts, and curtailment, and are the basis for hosting capacity evaluations.
Validation and standards alignment: Results are compared to the applicable service quality framework: ANSI C84.1 Range A for North American service points and EN 50160 statistical limits for European public networks. Adjustments include regulator setpoints, LDC R/X values, capacitor placement, DER curve parameters, and, when necessary, conductor upgrades.
Conclusion
Distribution transformers, conductors, and connected equipment collectively define feeder voltage behavior. The simple but powerful relations and their three‑phase analog, together with voltage regulation (%) between no‑load and full‑load, provide first‑pass insight; time‑series simulations then resolve realistic operations with regulators, capacitors, and DER controls.
Standards frameworks set compliance targets: ANSI C84.1 Range A/B guide service and utilization voltage bands in North America, while IEC 60038 and EN 50160 define nominal voltages and statistical performance at public supply terminals in Europe.
Effective practice blends these references with the coordinated use of step‑voltage regulators per IEEE/IEC C57.15, shunt capacitors per IEEE 1036 and IEEE 18, and IEEE 1547‑compliant inverter functions to maintain voltage within limits across both peak-load sag and light-load/PV rise conditions. The result is a feeder that keeps service voltage where it needs to be—stable, compliant, and responsive to modern, variable operating realities.