Facebook
 Google
 GitHub
 Linkedin
Electron Images Predict Lithium Battery Failure Risk
University of California, San Diego researchers develop a statistical imaging tool to forecast lithium battery performance using data that battery labs already collect.
The most energy-dense battery in development today, lithium metal, is also one of the most unpredictable. When lithium deposits cluster unevenly, they form filament-like structures that can pierce the separator and short-circuit the battery. Until now, detecting that failure risk before it happens has been difficult and expensive.
Researchers at the University of California, San Diego have developed a tool that could change that. Their method analyzes scanning electron microscope (SEM) images of lithium anodes and applies a statistical model to evaluate the uniformity of lithium deposition. That uniformity—or rather, lack of it—turns out to be a strong predictor of battery stability.
Their study in PNAS could give engineers a low-cost, repeatable way to evaluate battery risk across chemistries, cycling protocols, and operating conditions—without modifying existing test workflows.
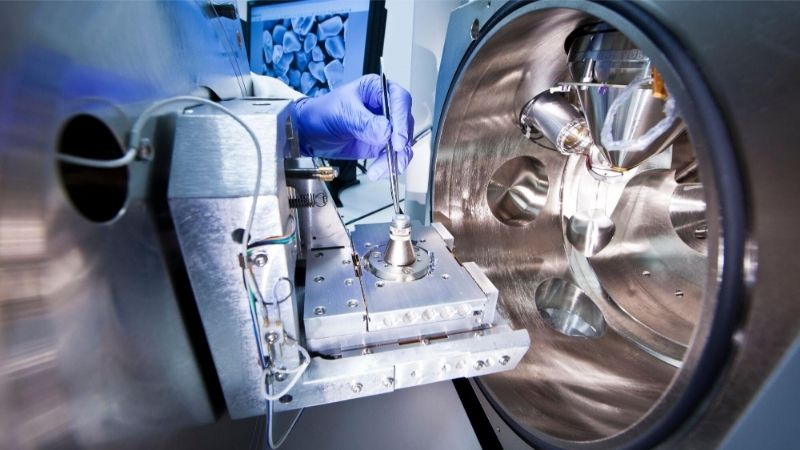
Scanning electron microscope. Image used courtesy of Adobe Stock
SEM Meets Stats
SEM is already a standard in battery research labs, offering high-resolution views of lithium morphology. But interpretation has always been a problem. Terms like “dendritic,” “mossy,” or “whisker-like” are common in the literature, but they’re also subjective. The UC San Diego team, led by Jenny Nicolas and advised by Professor Ping Liu, aimed to strip out that ambiguity by building a quantitative framework from the ground up.
At the heart of their approach is a simple, well-established statistical metric: the Index of Dispersion (ID). Commonly used in ecology and particle analysis, ID describes how evenly features are distributed in space. The researchers applied it to SEM images by:
- Converting grayscale images into binary maps (black and white)
- Dividing the image into uniform regions
- Counting the number of white pixels (representing lithium deposits) in each region
- Calculating the variance-to-mean ratio, i.e., the ID
An ID of 0 means a completely uniform lithium distribution. Higher numbers reflect more clustering, which is precisely the kind of structure that precedes battery failure.
![]()
The total number of white pixels (A), representative of the boundaries between lithium particles, and the total number of pixels within each slice, divided into 16 slices (outlined in red) for the ID calculation. Each of the 16 slices contains 16 pixels (B-E). Image used courtesy of Nicolas et al.
From Model to Reality
The researchers first validated the method on 2,048 synthetic images with known particle distributions to test it. They showed that the ID metric scaled consistently with increasing heterogeneity. They applied the same workflow to real SEM images from lithium metal pouch cells that were cycled under varying current densities and areal capacities.
The results were striking. ID values remained low and relatively flat in cells that remained stable across 200 cycles. But in cells that failed early, the ID values spiked, often sharply, just before short-circuiting. Even more notably, high ID values were sometimes present before the cell showed signs of failure, suggesting the metric could act as a predictive diagnostic rather than just a postmortem tool.
_plated_Li_images_and_(B)_stripped_Li_images.jpg)
ID changes with increased cycling for different capacity conditions from (A) plated Li images and (B) stripped Li images. Image used courtesy of Nicolas et al.
The researchers also tested the model across different imaging angles and resolutions. While changes in image quality slightly shifted the raw ID values, the relative trends held, making the metric robust enough for comparisons across datasets, something battery researchers have historically struggled to achieve.
Predictive Power Without Added Cost
The UC San Diego team’s work applies not only to image processing but also to creating a standard language for lithium morphology. The study notes that much of the current literature depends on visual assessment or vague descriptors. Introducing a quantitative index allows researchers to directly compare results across labs and even automate quality screening during battery testing.
Importantly, the team notes that this is not a real-time diagnostic, but it is something that could be layered onto the data researchers are already collecting. The workflow is compatible with off-the-shelf SEM images and does not require specialized hardware or retraining of AI models. It’s as close to plug-and-play as post-cycling battery diagnostics gets.
The framework could also support AI integration. In future work, the researchers suggest pairing the ID-based metrics with machine learning models to flag emerging failure modes, classify deposition types, or optimize electrolyte formulations. There’s also potential for expanding beyond lithium metal systems into solid-state batteries, lithium-sulfur batteries, or any platform where morphology affects cycle life.
For engineers designing next-generation batteries, especially for electric vehicles or long-duration storage, the big takeaway is predictive reliability. Knowing when and why a cell might fail without destructive teardown offers a powerful edge in prototyping and quality control.