Facebook
 Google
 GitHub
 Linkedin
Climate TRACE Technology Provides Emissions Accountability
A new satellite-based tool used artificial intelligence (AI) to provide greenhouse gas emission data for more than 72,000 individual locations worldwide.
The climate is growing warmer, and it will take a global effort to prevent calamity. The most significant global climate agreement took place in Paris in 2015. The Paris Agreement, created by the United Nations (UN) and signed by all but a handful of smaller third-world nations, requires countries to set greenhouse gas (GHG) emission reduction pledges. GHG emissions including carbon dioxide (CO2) and methane are known to trap heat from sunlight and are causing gradual warming of the Earth’s atmosphere and oceans.
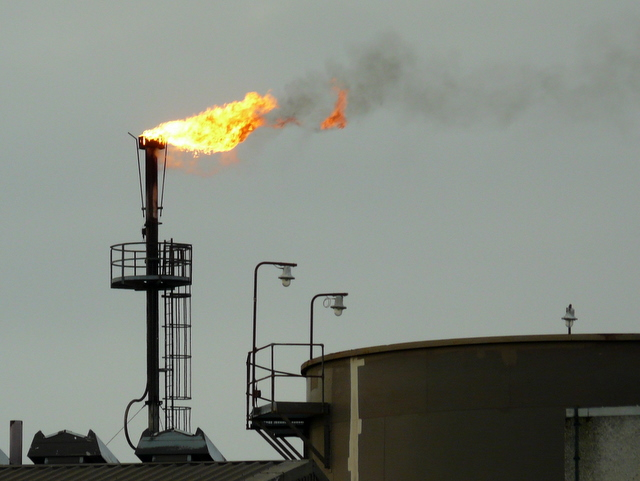
Gas flare at Nigg Oil Terminal. Image used courtesy of Sylvia Duckworth, CC BY-SA 2.0 via Wikimedia Commons
Agreement Aims for Net-Zero GHG Emissions by 2050
The targets that come from the pledges, called nationally determined contributions (NDCs), are designed to prevent the average global temperature from rising 2 degrees Celsius (3.6 degrees Fahrenheit) above the global temperature from the pre-industrial period (the early 1800s) and to attempt to keep that rise under 1.5 degrees C. The agreement also has set a goal of global net-zero GHG emissions by the second half of this century.
To demonstrate progress, every five years countries are expected to report on their emissions. But because there are no enforcement mechanisms to ensure that the targets they set are met, the systems have problems. In addition, as of 2021, none of the signatory nations have provided a full accounting of GHGs to the UN, and 52 of the nations have not submitted any emission numbers for the past 10 years.
Climate TRACE Creates Global GHG Inventory
Unfortunately, the UN has been willing to accept the numbers it receives, and there has not been any way to independently check the emission claims from nations and corporations. At the recent climate conference in Egypt (COP27), this changed as an independent group called Climate TRACE created a system that monitors sources such as coal mines, oil fields and refineries, transportation systems, power stations, and industrial facilities to determine emissions of both CO2 and methane.
Using data from more than 300 satellites; 11,000 air, sea, and land-based sensors; and large amounts of additional commercially available information, Climate TRACE has created a global GHG inventory of more than 72,000 individual sites worldwide from 2015 through 2021. These sites include individual power plants, steel mills, oil and gas fields, refineries, coal mines, and aluminum and cement plants, as well as road networks, airports, agricultural resources, and even individual container ships and sea-going tankers.
Artificial Intelligence Grows More Precise as Data Is Added
Climate TRACE is made up of 10 coalition members, and the GHG inventory it created uses data from more than 90 other researchers and contributing organizations. Using artificial intelligence (AI) data patterns and slight differences in satellite imagery, GHG emissions are analyzed and calculated from individual sources around the globe. These emission levels are independent of the reported GHG emissions from nations, corporations, and individual facilities. As more data is used to create the inventory, the AI and machine learning models become increasingly precise.
Climate TRACE has made the information and its underlying data available on its website at no charge. The site allows the examination of the data by 20 different types of industries as well as by examining specific locations.
Oil and Gas Emissions Findings Prove Distressing
Using the Climate TRACE website, some alarming information can be uncovered. The top 500 GHG emissions sources accounted for 14 percent of global emissions in 2021 but made up less than 1 percent of the total facilities examined. In other words, these top individual sites produced more emissions than the entire United States in 2021. Electric power plants created more than half of these global emissions, while 26 of the 50 largest emission sources resulted from oil and natural gas fields and the transportation and refining of these fossil fuels.
The oil and gas findings are particularly distressing when it comes to limiting increases in global temperature to less than 2 degrees C. Climate TRACE has found through its direct measurements that the oil and gas emissions that top-producing countries report to the UN are a third less than the actual GHG emissions from these sources. Clearly, up until now, with no capability to measure actual emissions, there has been no real ability to regulate or hold the oil and gas industry accountable.
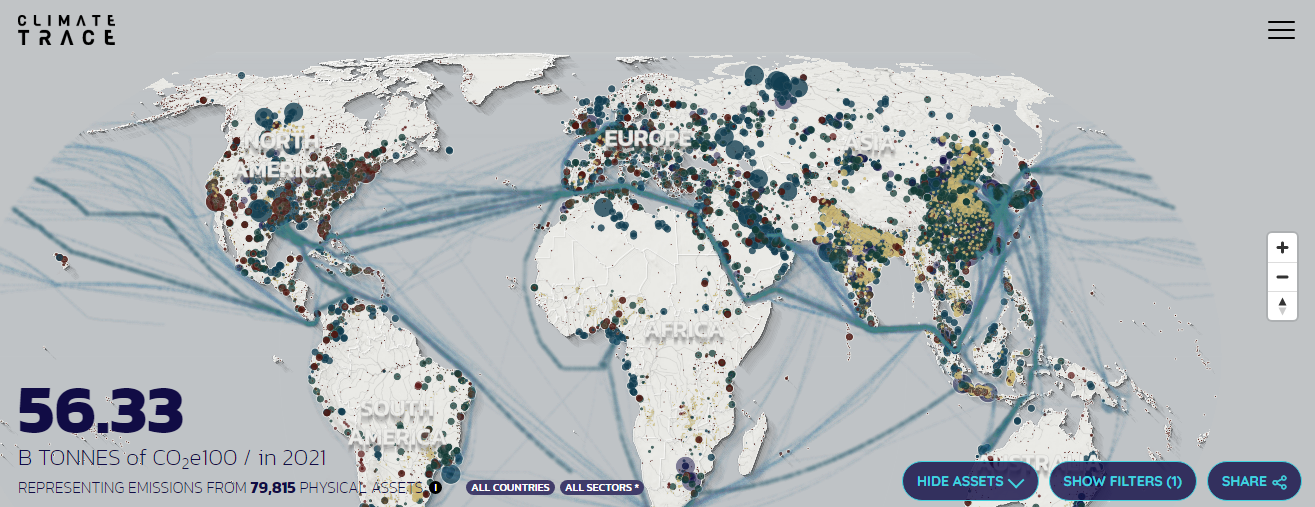
Climate TRACE’s world map indicates sources of GHG emissions. Image used courtesy of Climate TRACE
Climate TRACE Website Shows Scale of Challenges
The Climate TRACE website is particularly fascinating since examining local emission sources (airports and landfills are big) brings a better understanding of the scale of the challenges faced. The site is too complex to operate on a cell phone and needs the graphic power of a laptop or desktop computer to be used.
On a global scale, it is easily seen for example how the emissions of North America, Asia, and Europe dwarf all of central and southern Africa. Looking at various regions by different industrial sectors also provides an interesting glimpse at how wealth and natural resource extraction are distributed.
Climate TRACE plans to add its 2022 data shortly and plans to use its AI system to expand and refine the emission data from every industrial sector. With Climate TRACE, there is finally a tool that can be used to hold the world’s biggest emitters accountable and to develop plans to reduce overall emissions, sector by sector.