Facebook
 Google
 GitHub
 Linkedin
Understanding Phasor Representation of Alternating Voltage
The instantaneous levels of alternating current and voltage are vector quantities, but because the levels are continuously changing, an AC waveform must be represented by a rotating vector or phasor.
Quantities that can be completely represented by a number of units are termed scalar quantities. Some examples of scalar quantities are temperature, volume, and resistance. Other quantities, such as force and velocity, must have a direction indicated and the number of units stated if they are to be completely specified. Such quantities can be graphically represented by a line that has a length proportional to the number of units, with the line drawn at an angle concerning some reference direction. This line is termed a vector, and the quantity it represents is classified as a vector quantity.
Phasors
A phasor is a vector rotating at a constant angular velocity. The sinusoidal output voltage produced by the simple generator can be represented by the phasor diagram shown in Figure 1. Here OA is a rotating vector (or phasor) with a constant angular velocity and a length that represents the peak output voltage Em. The arrowhead identifies the end of the phasor that moves, and the other end is the axis of rotation. By convention, the direction of phasor rotation is taken counterclockwise.
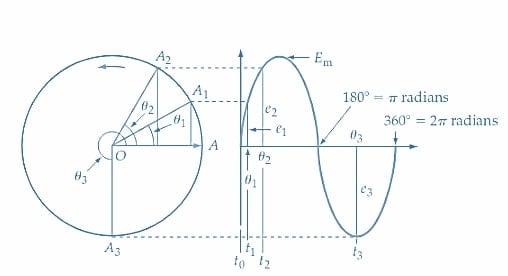
Figure 1. Phasor representation of a sine wave. Phasor OA rotates in a counterclockwise direction, and its length equals the peak voltage Em. At any angle θ, OA sinθ equals the instantaneous value of the sine wave. Image used courtesy of Amna Ahmad
The instantaneous value of the generated voltage represented by the phasor depends on the angle of the phasor with respect to the zero level. At time t = 0 on the waveform in Figure 1, the angle is θ = 0, and the instantaneous voltage level is zero. At t1, the angle is θ1, and the instantaneous level is e1, as illustrated in the figure.
At t1, \(e_{1}=(OA)sin\theta_{1}=E_{m}sin\theta_{1}\)
At t2, \(e_{s}=E_{m}sin\theta_{2}\)
And at t3, \(e_{3}=E_{m}sin\theta_{3}\)
At each of these instants, the voltage level is represented by the stopped phasor (or vector) OA1 at an angle θ1, OA2 at an angle θ2, and OA3 at an angle θ3. Any sinusoidal AC voltage or current can be represented by a phasor, and instead of degrees, the angles may be expressed in radians.
Example 1
Draw the phasor diagrams for the following voltages:
\[(a)V_{1}=15Vsin35\degree,(b)V_{2}=10Vsin\,sin\,60\degree,(c)V_{3}=12Vsin\,135\degree\]
Solution
See Figure 2.
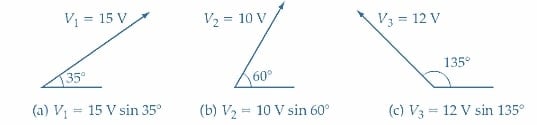
Figure 2. Phasor diagrams for Example 1. Image used courtesy of Amna Ahmad
Addition And Subtraction of Phasors
Phasor Addition
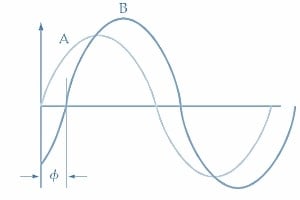
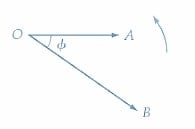
In Figure 3, two sinusoidal waveforms (A and B) are shown together, with the phasor representing each. It is seen that waveform B has a larger amplitude than waveform A. So, phasor OB is longer than phasor OA. Also, waveform B starts to grow positively from its zero level φo after the beginning of waveform A. Consequently, waveform B lags waveform A by φo, so the phasor OB is shown φo behind OA. It can also be said that waveform A leads waveform B by φo.
(a) Waveform
(b) Phasors
Figure 3. Two waveforms and their phasors. OB is larger than OA because waveform B has a higher peak value than waveform A. Waveform A leads waveform B by the angle φ; consequently, phasor OA leads phasor OB by φ. Image used courtesy of Amna Ahmad
The instantaneous level of waveform A can be written as
\[e_{A}=OA\,sin\,\theta\]
and the instantaneous level of waveform B is
\[e_{B}=OBsin(\theta-\varphi)\]
Now consider Figure 4(a), in which the two waveforms are shown to be outputs from each of two series-connected generators. The resultant output of the two in series is the phasor sum of the two waveforms. Figure 4(b) shows how the instantaneous levels of A and B may be added to give the resultant waveform C. At t1, a1+b1 gives point 1 on waveform C. At t2, a2+b2 gives point 2 on waveform C, and so on. It is seen that waveform C lags waveform A by an angle αo. So, waveform C is represented by phasor OC lagging αo behind OA [see Figure 4(c)].
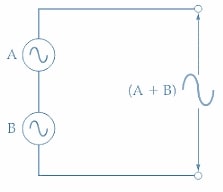
(a) Two sine wave generators in series
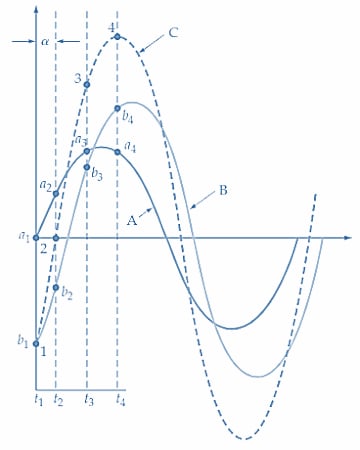
(b) Addition of instantaneous levels of two sine waves
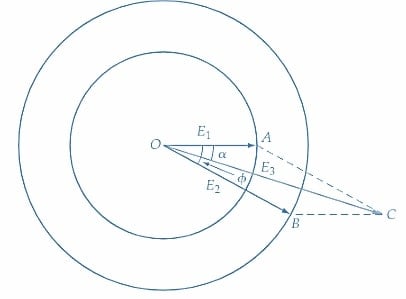
(c) Phasor addition
(d) Phasor addition
Figure 4. To determine the resultant output from two series-connected AC generators, the instantaneous levels of the waveforms can be added together. Alternatively, phasors OA and OB, representing each voltage, can be added graphically to obtain the resultant OC. Image used courtesy of Amna Ahmad
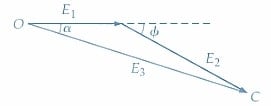
Another method of obtaining the resulting waveforms A and B is illustrated in Figure 4(c). A parallelogram is constructed, with AC drawn equal to and parallel with OB and BC equal to and parallel with OA. The resultant diagonal of the parallelogram (OC) represents the amplitude of waveform C, and the angle αo is the angle by which waveform C lags waveform A. Another approach to obtaining the same result is shown in Figure 4(d). Here, OA, identified as E1, is first drawn horizontally. Then E2 (which is OB) is drawn from the end of E1 and at an angle φ with respect to E1. The resultant (E3 or OC) is found by drawing a line from O to the end of E2. The angle of E3 with respect to E1 is again seen to be -αo.
Instead of graphically adding the two phasors, the results may be obtained mathematically. Referring to Figure 5, each phasor is resolved into horizontal and vertical components (by trigonometry). The arithmetical sum of the horizontal components is then the horizontal component of the resultant. Similarly, the arithmetical sum of the vertical components is the vertical component of the resultant.
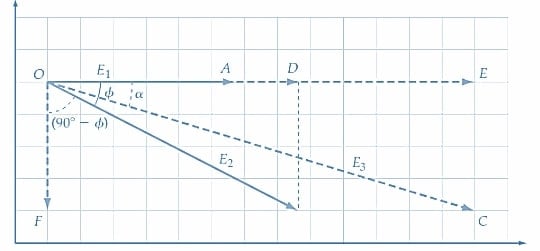
Figure 5. The resultant of two phasors can be determined by first resolving each into its horizontal and vertical components. The two horizontal quantities are added together, and the two vertical quantities are added to give the horizontal and vertical components of the resultant. Image used courtesy of Amna Ahmad
Horizontal component of E1 = OA
Horizontal component of E2 = OD = E2 cos φ
Total of horizontal components = OE = OA + OD = E1+E2 cos φ
Vertical component of E1 = 0
Vertical component of E2 = OF = -E2 cos (90°-φ) = -E2 sin φ
Total of vertical components = 0 + OF= -E2 sin φ
The negative sign here indicates that the vertical component is measured down from the horizontal rather than up.
Resultant
\[E_{3}=OC-\sqrt{(OE)^{2}+(OF)^{2}}\]
Angle
\[=tan^{-1}(\frac{OF}{OE})\]
Example 2
Two sinusoidal quantities are given as v1 = 120 sin θ and v2 = 75 sin (φ - 30°). Determine the results obtained when v1 and v2 are added.
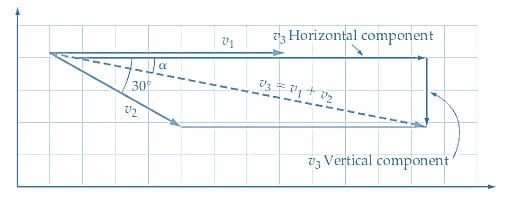
Figure 6. The sum of two phasors, v3 = v1 + v2. Image used courtesy of Amna Ahmad
Solution
Referring to Figure 6:
Horizontal component of v1 = 120
Horizontal component of v2 = 75 cos 30o ≈ 65
Horizontal component of v3 = 120 + 65 = 185
Vertical component of v1 = 0
Vertical component of v2 = -75 sin 30o = -37.5
Vertical component of v3 = 0 – 37.5 = -37.5
\[v_{3}=\sqrt{185^{2}+37.5^{2}}=188.8\]
\[Angle=tan^{-1}{\Bigg[}\frac{v_{3}\,vertical\,component}{v_{3}\,horizontal\,component}{\Bigg]}\]
\[=tan^{-1}\frac{-37.5}{185}=-11.5\degree\]
\[v_{3}=188.8sin(\theta-11.5\degree)\]
Phasor Subtraction
Sometimes instead of phasor addition, phasor subtraction is required. An example of this occurs with the circuit shown in Figure 7(a), where.
E3 = E1-E2
Figure 7(b) shows the process of phasor subtraction. E2 is shown as θo ahead of E1. For subtraction, E2 is reversed to become -E2, as illustrated. The resultant (E3) is then the phasor sums of E1 and -E2. Again, the results may be found mathematically or by either of the two graphical methods described.
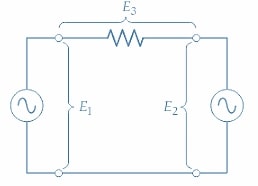
(a) E3 is the phasor difference between E1 and E2
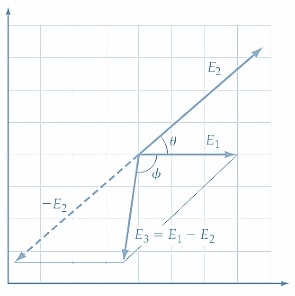
(b) Determination of E3
Figure 7. The phasor difference of two phasors, E1 and E2, can be determined by summing E1 and -E2. Image used courtesy of Amna Ahmad
Phasor addition and subtraction are not limited to two phasor quantities. The resultant of any number of phasor quantities can be found; some of these may require phasor addition, while others may have to be subtracted.
Example 3
Determine v1 - v2 for the two quantities specified in Example 2.
Solution
Referring to Figure 8
Horizontal component of v1 = 120
Horizontal component of -v2 =75 cos (180o - 30o) ≈ -65
Horizontal component of v4 = 120 - 65 = 55
Vertical component of v1 =0
Vertical component of -v2 = 75 sin (180o - 30o) = 37.5
Vertical component of v4 = 0 + 37.5 = 37.5
\[v_{4}=\sqrt{55^{2}+37.5^{2}}=66.6\]
\[Angle=tan^{-1}\frac{-37.5}{55}=34.3\degree\]
\[v_{4}=66.6sin(\theta+34.3\degree)\]
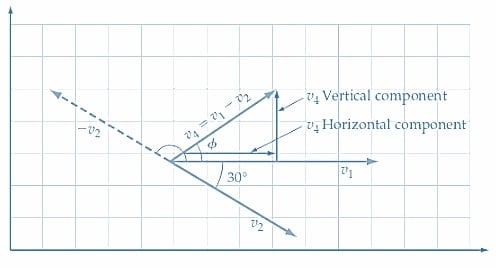
Figure 8. Difference between the two phasors, v4 = v1 – v2. Image used courtesy of Amna Ahmad
Takeaways of Phasor Representation of Alternating Voltage
The phasor representation of alternating voltage is a mathematical technique to simplify AC circuit analysis. It involves representing the time-varying voltage or current as a single complex number or phasor, which has a magnitude and phase angle. By using phasor diagrams, the behavior of AC circuits can be analyzed in a much more efficient and intuitive manner.
Featured image used courtesy of Adobe Stock
Related Content