Facebook
 Google
 GitHub
 Linkedin
Debunking GaN Cost and Reliability Myths
The GaN market is booming. The latest data from analysts Yole predicts a 49% CAGR for GaN between 2022 and 2028. Many companies understand GaN's potential to reduce smaller systems with higher power densities and higher efficiency.
This article is published by EEPower as part of an exclusive digital content partnership with Bodo’s Power Systems.
The GaN market is booming. The latest data from analysts Yole predicts a 49% CAGR for GaN between 2022 and 2028. While we could debate the numbers, it is obvious that many companies understand GaN's potential to reduce smaller systems with higher power densities and higher efficiency. GaN is also seen as a green solution that can be marketed. Amazon, for example, is marketing GaN-powered chargers under the slogan "go greener."
Innoscience has shipped over 300 million GaN chips into diverse applications, including chargers, data centers, and LIDAR systems. But despite this success, some designers are reluctant to switch to GaN because of two common misconceptions—price and reliability.

Image used courtesy of Adobe Stock
The GaN Cost Question
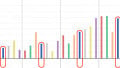
GaN ICs can be two to three times more expensive than silicon devices. However, Figure 1 shows a price comparison taken from published information on distribution websites of 650 V Innoscience’s InnoGaN HEMTs versus silicon super junction devices at similar voltage and current ratings. The graph shows that for any given on-resistance (Rds(on)), InnoGan is price-comparable with silicon devices. GaN is still a relatively young technology, so there is considerable room for further improvements in performance and cost reduction.

Figure 1. Price comparison of 650cV Innoscience’s InnoGaN HEMTs versus silicon super-junction devices. Image used courtesy of Bodo’s Power Systems [PDF]
This price comparison is made using ICs produced and sold by Innoscience. How has it been achieved? First, Innoscience follows an IDM (integrated device manufacturer) model on two large and dedicated 8-inch fabs, enabling it to leverage economies of scale. Figure 2 shows a picture of the company’s Suzhou facility which occupies 25 hectares–the equivalent of 35 soccer fields–capable of producing 70,000 wafers per month. There the company employs the same high throughput manufacturing processes that have been refined and optimised for silicon processing over many years. Therefore, and again according to a Yole report, last year Innoscience was already processing 10,000 8-inch wafers per month. The IDM model means Innoscience retains all critical manufacturing processes in-house, shortening development time and improves intrinsic device technology. By comparison, fabless GaN companies which do not control all processes but instead rely on third-party manufacturing partners, may not be able to implement technology and process improvements as quickly.

Figure 2. Suzhou facility which is capable of producing 70,000 wafers per month. Image used courtesy of Bodo’s Power Systems [PDF]
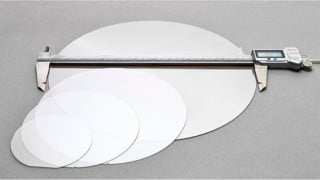
Innoscience has learned the lessons that silicon pioneered by increasing wafer diameters, thereby reducing device costs. From its beginnings, Innoscience has focused on 8-inch wafers. If we consider a 2 mm x 2 mm die, a 6-inch wafer allows 3886 devices to be made. Using 8-inch wafers, 7265 parts can be made. By nearly doubling the number of devices that can be made per wafer the individual device cost drops by 30 to 40%, even allowing for the increased epi-wafer price.

Figure 3. Uniformity of on-resistance (RDS(on)) and leakage current (IDSS) across the wafer. Image used courtesy of Bodo’s Power Systems [PDF]

Figure 4a. The figure of Merit is ten times better than silicon. Image used courtesy of Bodo’s Power Systems [PDF]

Figure 4b. A reduced number of components saves cost. Image used courtesy of Bodo’s Power Systems [PDF]

(a)

(b)
Figure 5a+b. On-resistance stays well below 20% both for high voltage and low voltage. Image used courtesy of Bodo’s Power Systems [PDF]
Finally, Innoscience has optimized the epitaxy and device processing to maximize yield. Figure 3 shows very high uniformity of on-resistance (RDS(on)) and leakage current (IDSS) across the wafer, with just a small edge exclusion, and not only within the wafer but also wafer to wafer reproducibility. The graphs plot the characteristics for over 100 wafers and demonstrate that the process is very stable and with high yield.
This is how Innoscience has managed to keep the cost of the GaN die very competitive. But there is another consideration. GaN has a Ron Qg Figure of Merit that is 10 times better than silicon which enables GaN to switch at much higher frequencies while keeping high efficiency (Figure 4a). This means that smaller passive components can be used, making the power system smaller, and often cheaper (Figure 4a).
The other benefit of GaN is that it does not have a body diode, so there is no reverse recovery current (Figure 4b). Therefore, instead of using complex topologies such as dual boost bridgeless PFC which are typically used with silicon devices, much simpler systems such as a totem pole configuration can be employed. This reduces the number of components required and saves costs (Figure 4b).
So not only are GaN devices themselves price competitive with silicon, but they also enable smaller and simpler systems which are often cheaper than the silicon-based equivalent. I hope readers can now appreciate that GaN is not more expensive thanks to silicon and it is certainly price-competitive.
The GaN Reliability Question
Let’s tackle the second myth about GaN–the potential lack of reliability.
First, although it is only now being used in mass power electronics applications, GaN is not a new technology. It has been studied, developed, and written about for at least 20 years. The degradation mechanisms—mainly time-dependent breakdown, charge-trapping, and hot-carrier wear-out—are well understood and can be accommodated and devices can be designed accordingly.
Recently, and also thanks to a white paper originally published by Dr. Bahl at Texas Instruments, a JEDEC guideline has emerged specifically for GaN power-switching devices (JEP 180). JEP 180 defines tests that should be performed on devices to mimic the real use conditions of a device in an application (e.g., soft-switching, hard-switching, etc.). With silicon MOSFETS, once a device has passed the JEDEC standard tests, then the device is qualified and that has been proven to be sufficient.
In this case of GaN, however, while still performing JEDEC standard tests is mandatory, reliability experts realized that additional extended tests are needed to avoid failures in real switching conditions as the one described in JEP 180. Currently, JEP 180 is a guideline, but it is expected to become a standard, and Innoscience – and other companies – test in accordance with it.
Figure 5a provides more detail. JEDEC 180 advises that a device should be stressed under resistive switching conditions. A “bad” device will exhibit an increase in on-resistance due to the charge-rapping effect, showing degradation once switching from high voltage begins. A “good” device will only show minor differences, and the dynamic on-resistance ratio (i.e. ratio between the static and dynamic on-resistance) should remain lower than 20%. Innoscience performs this test for 1000 hours demonstrating a very stable on-resistance that stays well below 20% both for the high-voltage (Figure 5a) and low-voltage (Figure 5b) InnoGaN devices.

Figure 6. Reverse bias test performed between 1200V 1300V and at 150°C. Image used courtesy of Bodo’s Power Systems [PDF]
Of course, Innoscience also routinely performs typical JEDEC testing, both at the die and at the package level. Such tests include high-temperature gate bias (HTGB), high-temperature reverse bias stress (HTRB), and even H3TRB (high temperature, high humidity, high reverse bias test), which is a very stringent test typical for automotive.
Additionally, Innoscience also performs tests to fail to extrapolate lifetime expectancy. The tests are performed beyond the device's maximum specifications (e.g. for a 650V device, the accelerated reverse bias test is performed between 1200V and 1300V, and at 150°C as shown in Figure 6). Accelerated tests show that the time required to bring the InnoGaN parts to failure at maximum rated drain voltage or maximum rated forward gate voltage exceeds 10 years lifetime at 10ppb level!
These excellent reliability characteristics are a result of Innoscience’s IDM model and expertise where all the important design elements (from epitaxy to device design) have been addressed.
So as we see, GaN technology, properly implemented, is extremely reliable, and users can eliminate this second concern. With proven reliability and price competitiveness, the last remaining barriers stopping users from employing GaN power devices have been removed.
This article originally appeared in Bodo’s Power Systems [PDF] magazine.
Related Content