 Facebook
 Google
 GitHub
 Linkedin
Modeling of Powder Core Inductors for Assessing the Accuracy of Finite Element Simulation
This article models the inductance of various powder core shapes using experimental data. It also compares inductance values obtained through simulation and analytical calculations with experimental results, highlighting the importance of accurate modeling in simulation tools.
This article is published by EEPower as part of an exclusive digital content partnership with Bodo’s Power Systems.
Inductors are fundamental components in power electronics systems, playing critical roles in energy storage, filtering, and voltage regulation. They significantly contribute to the overall size and weight of power converters, often becoming limiting factors in compact designs.
Image used courtesy of Freepik
A key strategy to reduce magnetic component size is selecting core materials with superior magnetic characteristics, tailored to the converter’s operating frequency and power requirements. Thus, the choice of magnetic core material is crucial in the design process [1–2]. Among various options, powder cores are especially valued for their high saturation flux density and thermal stability, making them suitable for high-frequency, high-current applications such as EV inverters, solar inverters, and DC-DC converters [3–4].
The Challenge of Accurate Inductor Modeling
Despite these advantages, accurately modeling powder core inductors remains challenging, particularly under DC bias and across different geometries. Analytical methods based on manufacturer-provided formulas have gained popularity for incorporating geometry-specific parameters like magnetic path length, effective permeability, and fringing effects. Studies such as [5–6] have validated these methods against experimental data, showing improved accuracy compared to the previous approaches.
Designers increasingly use electromagnetic simulation tools like ANSYS Maxwell to predict inductance behavior. While these tools offer flexibility and speed, they often rely on generic input data, especially B-H curves typically provided for specific core shapes and sizes. In toroidal cores, the magnetic field is uniformly distributed due to the closed-loop geometry, minimizing flux leakage and resulting in negligible stray fields and predictable magnetic behavior. However, in complex geometries like EQ and LP cores, significant inaccuracies can arise due to differences in magnetic path distribution and flux leakage [7].
The absence of magnetic characterization that excludes stray field effects in simulations leads to discrepancies between simulated and measured inductance, potentially causing suboptimal designs, more prototyping cycles, and degraded performance. This issue is particularly critical in compact, high-efficiency systems where magnetic behavior directly impacts thermal performance, EMI compliance, and overall reliability.
To evaluate the accuracy of inductance estimation under DC bias, this study investigates three core geometries commonly used in power electronics: toroidal, EQ, and LP. For each, inductance is estimated using empirical equations and 3D electromagnetic simulations, and results are compared with physical measurements.
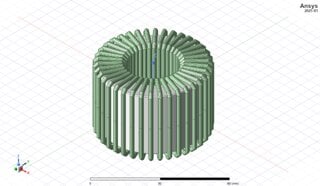
(a)
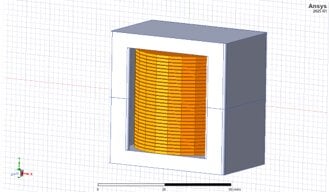
(b)
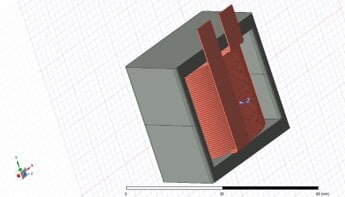
(c)
Figure 1. The geometry of the inductors using (a). Toroidal core (b). EQ core (c). LP core. Image used courtesy of Bodo’s Power Systems [PDF]
Results and Discussion
Three powder core inductors were analyzed: a toroidal core with 42 turns, an EQ core with 29 turns, and an LP core with 46 turns. Inductance values were calculated using empirical equations and simulated using ANSYS Maxwell. Figures 1 to 3 show the geometries of the inductors in the 3D ANSYS Maxwell simulation.
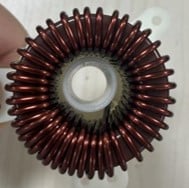
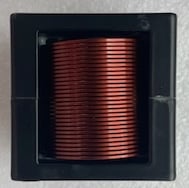
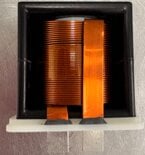
Physical prototypes were built and measured. Photographs of the three test samples are shown in Figure 2.
(a)
(b)
(c)
Figure 2. Sample photographs: (a) toroidal core inductor. (b) EQ core inductor. (c) LP core inductor. Image used courtesy of Bodo’s Power Systems [PDF]
Toroidal Core Results Show Strong Correlation
The toroidal core showed strong agreement across all methods. EQ and LP cores had higher simulated inductance due to incorrect input reference permeability in the simulation. Table I summarizes the calculated, simulated, and measured inductance values. The toroidal core demonstrated strong agreement across all three methods: empirical-based equation, simulation, and physical measurement. This confirms that using relative permeability as input for simulation is valid for toroidal geometries, where the magnetic path is uniform.
Why EQ and LP Core Simulations Deviate
In contrast, the EQ and LP cores showed significantly higher inductance values in simulation compared to both calculated and measured results. This discrepancy arises from the wrong use of the reference relative permeability of a core in the datasheet instead of using the actual relative permeability.
It can be observed from these results that the actual permeability of the core material in the EQ/LP core is lower than the reference permeability in the datasheet. In such geometries in low-permeability powder cores, the leakage flux is high, which results in an increased effective AL value. Therefore, to have a reference permeability of 60, the actual permeability of the material is lower to compensate for the stray field.
The Importance of Using Accurate B-H Curves
So, even at zero amps, inserting the reference permeability of the core in the simulation will result in higher inductance than reality. Using the specific accurate B-H curve for each core without the effect of stray fields is so important to get the correct inductance from the simulation. Manufacturer-provided formulas, which incorporate geometry-specific factors, offer much better alignment with real-world measurements.
Table 1. Inductance comparison across empirical-based equation, Simulated, and Measured Methods
| Core Type | Empirical-based equation Inductance (µH) | Simulated Inductance (µH) | Measured Inductance (µH) | Observation |
| Toroidal |
L0 A=303.4 L46 A=122.8 |
L0 A=307 L46A=125 |
L0 A=312 L46A=117 |
Excellent agreement across all methods |
| EQ |
L0 A=99.2 L79 A=67 |
L0 A=141 L79 A=90 |
L0 A=101.4 L79 A=69.4 |
Simulation overestimates inductance |
| LP |
L0 A=292.3 L16 A=250.8 |
L0 A=378 L16 A=287 |
L0 A=300 L16 A=249 |
Simulation overestimates inductance |
Conclusion
Accurate simulation of powder core inductors, especially the inductance under DC bias, requires careful consideration of core geometry and magnetic field distribution. Effective permeability is influenced by stray fields, and B-H curves must be geometry-specific and without stray field contribution to avoid inaccuracies in the simulations. This study presents an empirical model to calculate the inductance value under any DC bias. Maxwell simulations have been done using the permeabilities provided in the datasheets as reference permeability and the reduced one under DC bias. Experimental tests across toroidal, EQ, and LP cores showed that simulations are reliable when accurate, shape-specific, and pure magnetic data are used.
References
[1] M. Kącki, M. S. Ryłko, J. G. Hayes, and C. R. Sullivan, “Magnetic material selection for EMI filters,” in Proc. IEEE Energy Conversion Congr. Expo. (ECCE), Oct. 2017, pp. 2350–2356.
[2] Y. Itoh, S. Kimura, J. Imaoka, and M. Yamamoto, “Inductor loss analysis of various materials in interleaved boost converters,” in Proc. IEEE Energy Conversion Congr. Expo. (ECCE), Sep. 2014, pp. 980–987.
[3] J. M. Silveyra, E. Ferrara, D. L. Huber, and T. C. Monson, “Soft magnetic materials for a sustainable and electrified world,” Science, vol. 362, 2018, Art. no. eaao0195.
[4] K. J. Sunday and M. L. Taheri, “Soft magnetic composites: recent advancements in the technology,” Metallurgical Powder Report, vol. 72, pp. 425–429, 2017. [Online]. Available: https://doi.org/10.1016/j.mprp.2016.08.003
[5] J. Imaoka, K. Okamoto, M. Shoyama, Y. Ishikura, M. Noah, and M. Yamamoto, “Modeling, magnetic design, simulation methods, and experimental evaluation of various powder cores used in power converters considering their DC superimposition characteristics,” IEEE Trans. Power Electron., vol. 34, no. 9, pp. 9033–9051, Sep. 2018.
[6] T. Aoki, J. Imaoka, M. Yamamoto, and K. Yoshimoto, “Comprehensive analysis of coupled inductors with powder cores used in interleaved converter: Measurement, modeling, design methods, and experimental evaluation,” in Proc. IEEE 13th Int. Conf. Power Electron. Drive Syst. (PEDS), Jul. 2019, pp. 1–8.
[7] P. C. Andrei, I. Caciula, M. Stanculescu, and G. M. Vasilescu, “FEM analysis of the magnetic field for BH relationship evaluation,” in Proc. Int. Symp. Fundam. Electr. Eng. (ISFEE), Nov. 2014, pp. 1–6.
This article originally appeared in Bodo’s Power Systems [PDF] magazine.