Facebook
 Google
 GitHub
 Linkedin
Methodology for Specifying Bus Bars in High Density Power Converters
The evolution of high-density power converters brings harsher constraints to the converters introducing technical issues for bus bar designers. This article presents a methodology developed to collect the electrical, thermal, and magnetic design constraints of laminated bus bar (LBB), through Bus Bar Calculator™, a software derived from GT-PowerForge (GT-PF).
The power conversion industry is under increasing pressure in terms of product performance, cost, and manufacturing quality. This trend brings challenging technical constraints on the converter sub-assemblies resulting in a degradation of efficiency, reliability, and cost-effectiveness.
An appropriately designed LBB for interconnection can effectively mitigate overshoot voltage, electromagnetic interference, switching loss and thermal stress for high power converters. This step is mandatory to avoid critical faults that could lead to converter failure. (Figure 1).

Figure 1. Effect of undersized elements on converter quality. Image used courtesy of Bodo’s Power Systems
As the voltage level raises, the multilevel converter topologies are a solution to limit the dv/dt stress, but that complicates the mechanical design and the definition of electrical interactions between each conductor.
Determining these parameters reliably and accurately is critical for compactness, safety, electrical robustness, and thermal and magnetic performance concerns.
Bus Bar Calculator™, the result of a collaboration between MERSEN, LBB manufacturer, and GAMMA TECHNOLOGIES, GT-PowerForge software developer, is a software proposing an innovative methodology to collect the operating conditions of the converter quickly, efficiently, and accurately.
In the first part, the main LBB design constraints are detailed. In the second part, how a software-based solution can help gather the constraints is detailed.
Bus Bar Constraints
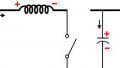
The switching devices operate at various frequencies inducing voltage peaks that are increased proportionally to the total stray series inductance of the Commutation Current Loop (CCL), as explained in Figure 2. To prevent converters to exceed the breakdown voltage, the stray inductance needs to be minimized. This parameter depends on the geometry and the structure of the interconnection, such as the bus bar, as illustrated in Figure 3.
Switching frequencies, from a few to several hundreds of kHz, generate current harmonics that need to be identified for thermal concern. Indeed, these harmonics could, due to skin and proximity effects, overheat the system if the LBB conductors aren’t well cooled or designed.

Figure 2. Inductance impact on surge voltage. Image used courtesy of Bodo’s Power Systems

Figure 3. Electrical diagram of the converter. Image used courtesy of Bodo’s Power Systems
To illustrate this phenomenon, Figure 4 shows the current density mapping, thermal heating, and temperature as a function of the current frequency passing through a copper bar, at 70 °C.

Figure 4. Skin effect on current density and thermal heating at different frequencies. Image used courtesy of Bodo’s Power Systems
These results are from Comsol Multiphysics®, a cross-platform finite element analysis, solver and multiphysics simulation software.
As it can be observed, the current density at the edges is higher at high frequency than low and it induces an increase of the temperature by 35 °C in the hotspot’s areas, which could delaminate the LBB, and eventually lead to short-circuit conductors.
More generally, the trend of dv/dt increases induce critical events, like partial discharges (PDs) and electrical breakdown. Hence, it is necessary to refer to the right standard for the right application to correctly define the electrical test voltages, and the insulation coordination, including clearance and creepage distances.
A differentiation must be made between clearance and creepage, as shown in Figure 5. Having enough insulation distances prevents ionization of the air gap and subsequent flashover or electrical tracking failures over a lifetime.

Figure 5. Representation of clearance & creepage distance. Image used courtesy of Bodo’s Power Systems
All these key elements (inductance, thermal heating, PDs, insulation distances) in the LBB design process, lead to opposite requirements and special attention should be given to the compromise between thermal, electrical, and magnetic constraints. Any kind of deviation could induce an immediate or delayed malfunction of the converter, potentially posing human risks.
Currently no converter design tool considers all the elements interconnecting passive and active components together for a better design process and optimization.
With Bus Bar Calculator™, the complete operating conditions of the converter and the technical and environmental interconnection requirements can be filled as input conditions to calculate the converter outputs needed to design the LBBs. It strives to standardize and communicate the busbar technical requirements through all the stakeholders of its complete design and considers the constraints at the start of the design phase. The whole is explained in the next section.
Mersen Bus Bar Calculator™
What is the GT-PF add-on, Bus Bar Calculator™?
The presented bus bar application, Bus bar Calculator™ is based on GT-PF, a multiphysics solver developed by GT, handling electrical, thermal, and magnetic physics to cover the complexity of a power converter design.

Figure 6. Standards for bus bar applications. Image used courtesy of Bodo’s Power Systems
MERSEN adds on GT-PF the Bus Bar Calculator™ application, computing the key electrical specifications of LBB, providing all the values to help designers make bus bars in a wide variety of converter topologies, within a few tens of seconds.
Input conditions in Bus Bar Calculator™
To design an LBB in the most optimized way, all the necessary operating parameters for the design must be collected, starting with the application area of the converter. As an example, a converter for railway applications is considered. Through the analysis and classification of all the standards for bus bar application in Figure 6, the appropriate standard can be selected for the correct definition of the insulation coordination and qualification tests.
Except for aeronautic, each application has at least one dedicated standard allowing the definition of:
- Clearance and creepage distance
- Dielectric test
- Clearance test
- Correction factor depending on altitude
Depending on the application the device doesn’t suffer from the same environmental constraints and design requirement changes. For example, at 5 kV, and overvoltage category 3, the clearance distance can vary with an x4 ratio as illustrated in Figure 7.

Figure 7. Clearance calculation for different applications. Image used courtesy of Bodo’s Power Systems
For aeronautic devices, a correction factor is applied on clearance to consider the altitude (or pressure), but no dedicated standard helps to define electric tests a low-pressure atmosphere to qualify the products. For high test voltages (> 5 kVrms) the standards are not self-sufficient, and the design must be adapted to reinforce the insulating part of LBBs, through internal design rules.
Then, the electrical operating parameters of the converter are essential for the correct dimensioning of the interconnection of the switching components. The converter topology and switching frequency must also be filled to allow the software to correctly calculate the voltage and current in each branch. (Figure 8).

Figure 8. Electrical operating parameters of 3-phase DC/AC converter topology. Image used courtesy of Bodo’s Power Systems
In this example:
- Udc = 2000 V + Uac = 400 V
- Power = 200 kW
- Switching frequency = 20 kHz
- 3-level T-type converter topology
The conductors composing the LBB, and the converter environment must be filled to consider all the constraints together, from the very beginning of the converter design phase, thus optimizing the complete system. (Figure 9).

Figure 9. Bus bar design elements for 3D model definition. Image used courtesy of Bodo’s Power Systems
The compilation of inputs in Bus Bar Calculator™ takes only 10 to 30 seconds. The first information displayed is the electrical schematic of the converter in Figure 10.

Figure 10. Electrical schematic of 3-level T-type converter topology generated by GT-PF. Image used courtesy of Bodo’s Power Systems
Outputs from Bus Bar Calculator™
Clicking on each node, AC and DC voltage and current passing through the considered node are provided. It also displays RMS current values passing through each conductor as illustrated in Figure 11 and Fourier transform, really mandatory to take into account skin and proximity effects on the thermal heating.

Figure 11. RMS current table value through all conductors. Image used courtesy of Bodo’s Power Systems
The maximum and repetitive peak voltages between each conductor in the interconnection, used for the calculation of insulation distances and electrical tests, are summed up in a table to ease and speed up the design phase, as illustrated in Figure 12.
To introduce the PD test, the addressed standard for PD test calculation and graph test is proposed in Figure 13 to explain the electrical constraints that will be applied to the LBBs.

Figure 12. Voltages between each conductor of the converter. Image used courtesy of Bodo’s Power Systems
Considering the voltage between conductors and the converter application, the 2 steps of PD test voltages can be calculated informing the user whether the test is mandatory. (Figure 14).

Figure 13. Partial discharges standard and graph. Image used courtesy of Bodo’s Power Systems

Figure 14. Partial discharges test voltage calculation. Image used courtesy of Bodo’s Power Systems
With this last information, the LBB insulation design can be finalized.
At the end of the day, by this process, through the consideration of skin and proximity effects, PD and dielectric tests requirement, the application and the environment of the converter, conductor and insulation designs are covered and can be used to optimize the busbar early in the converter development. The user will only need to create an account accessing www.busbarcalculator.com.
Conclusion
This work has resulted in the enhancement of a support tool for converter designers, engineering, and sales teams into a common basis of understanding summarized in a single document provided directly by the customer.
It allows all constraints from the converter to be defined on interconnecting LBB early in the converter design phase, minimizing errors and optimizing converter performance and cost.
With this process, thermal, electrical, and magnetic issues are brought to light and help create a common language across actors in the development process.
Later, other stakeholder products like capacitors, fuses, or cooling, can be added to this process to continue the optimization of the converters and move towards a complete converter development where all the actors would share the design constraints of each block and work together for a better optimization which will become essential to take better advantage of the new emergent technologies.
This article originally appeared in Bodo’s Power Systems magazine.