Facebook
 Google
 GitHub
 Linkedin
Measuring Temperature Swing with Optical Fibers during Power Cycling of Power Components
Power semiconductor components play an important role in the power electronics field and their reliability and lifetime have been attracting more attention recently. The power cycling test method has been widely used to accelerate the degradation of the device and evaluate its reliability and lifetime. This article presents a power cycling setup based on optical fibers to measure the power module’s chips junction temperature during operation under different loading conditions.
The testbench has been used to conduct both the DC and AC power cycling tests and the junction temperatures acquired by the optical fibers can help to evaluate the thermal stress during the operation, indicate the health status of the device under test (DUT), and built the relevant lifetime model.
Reliability Issues
Reliability issues of the power semiconductor components have been highly stressed in many applications such as renewable energy and traction. More knowledge about the expected lifetime of the device is demanded, [1]. For designers, to choose the proper power modules applied for realizing the specific mission profiles, relevant reliability investigation is necessary for the early development stage. For device manufacturers, a deep understanding of the power semiconductor component’s lifetime and failure modes can help to evaluate and improve in the aspect of packaging materials and designs [2] - [6].
The lifetime prediction methods generally consist of two categories. The first one is based on physics-of-failure (PoF) lifetime models, which are limited due to the lack of detailed information on the materials and geometries of the power modules. Another one is the analytical models, the many use of the rain-flow counting methods, etc, which all need experimental power cycling tests [7] - [9].
Power cycling test in power semiconductor devices generates repetitive thermal-mechanical stresses, which will bring accumulated fatigue and accelerate the aging of the device till the end of life.

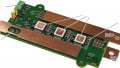
(a) Scheme of installation of optical fiber in contact with the chip Wto measure temperature. Image used courtesy of Bodo’s Power Systems

(b) DUT adapter PCB with optical fiber installed on the power module.
Figure 1. Optical fiber installation. Image used courtesy of Bodo’s Power Systems
Among other failure indicators, the junction temperature is one of the most strongly focused. One of the most critical bottlenecks of power cycling tests is that junction temperature can be derived by Vce,on (Vds,on) during DC power cycling, as the off time can be used to inject a monitoring current and measure the on-state voltage at low current this way, i.e., making effects of degradation such as bond-wire degradation, negligible. However, in the case of modern AC power cycling, this is not possible as injecting a measurement current requires additional circuitry able to disconnect the IGBT / MOSFET from the circuit, thus introducing measurement artifacts, such as stray inductance and resistance [4].
Normally, it has been believed that direct access to the chips to measure the junction temperature can be difficult due to the limit of the module packaging and the dielectric gel [8], even though the optical fibers can be a valid alternative for measuring the Tj in a non-invasive and isolated manner, especially under the case (AC power cycling) when the traditional TSEP (Temperature Sensitive Electrical Parameter) method is not easy to implement. Not until recently, one innovative optical fiber sensing technology is proposed by OpSense Solutions©, which enables an online junction temperature measurement during the power cycling test. In this article, the details of using the optical fibers to measure the junction temperate under both DC and AC power cycling tests are explained, also comes with the experimental results and conclusions.
Fiber Principle
The implementation of optical fiber sensor OTG-PM [10] makes the direct online junction temperature measurement method possible when conducting AC power cycling test. Details of the junction temperature measurement using an optical fiber sensor are described as follows.
Figure 1 depicts the way of using the isolated optical fiber to measure the junction temperatures of one 650V - 20A IGBT module in real-time. One cutout is made on top of the plastic housing of the power module in order to have the sensor able to reach out to the chip surface. As is essential to keep the packaging’s insulation property to assure that the converter can run under rated power, voltage, and normal working conditions, the temperature measurement can be challenging. Designed in a way that the miniature sensor head is protected by rigid ceramic tubing, which allows for easy piercing, the OTG-PM sensor can get in touch with the chip surface without removing the silicone gel. Before getting the sensor tip penetrated through the gel, the sensor is prepositioned with the help of fiber holders, and the target zone is determined to be between the two bonding wires in the active area [11].
Except for its ease of mounting on the gel-filled power module, the sensor’s fast response time feature (few ms), wide operating temperature range (-40 °C - 250 °C), immunity to EM and RF interference, etc., all make it well suited for in-situ junction temperature measurement during a power cycling test.

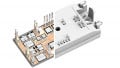
(l) 6-unit, 19” industrial rack array with detailed configuration.
(r) Three-dimensional mechanical layout of the developed test bench.
Figure 2. Power cycling setup at AAU Energy, Aalborg University. Image used courtesy of Bodo’s Power Systems
Case Study
The test setup shown in Figure 2 is designed to perform power-cycling tests on several kinds of samples and under different conditions, including varied junction temperature swings. As shown in Figure 3, two 3-phase converters are back-to-back connected in order to circulate power. A load converter is used to regulate the current through the inductor at the wanted amplitude and phase.

Figure 3. Schematic of the power cycling setup. Image used courtesy of Bodo’s Power Systems
Large space around the DUT converter is saved for optical fiber holder placement. Both DC- and AC- power cycling test can be conducted on this setup, and the experimental test results are shown below:
A. DC Power Cycling
The DC power cycling is conducted with a load current of 20 A, 2 s on/off time; the current is commutating between two phases of the power module. A diagram of the on-state voltage and gate voltage measurement results and a diagram of Tj vs time are reported in Figure 4.
B. AC Power Cycling
The AC power cycling is conducted under 400 V dc-link voltage, with an AC peak current of 20 A (fundamental frequency of 0.25 Hz). The corresponding junction temperature measurement result is shown in Figure 5, with a temperature swing of 80°C.

(a) On-state voltage and gate voltage measurement results. Image used courtesy of Bodo’s Power Systems

b) Junction temperature measurement result.
Figure 4. DC power-cycling test waveform. Image used courtesy of Bodo’s Power Systems

(a) Load current and voltage measurement results. Image used courtesy of Bodo’s Power Systems

b) Junction temperature measurement result.
Figure 5. AC power-cycling test waveform. Image used courtesy of Bodo’s Power Systems
Conclusion
This article demonstrates that implementing the OpSens optical fiber sensors on the DUT can be one effective and practical way of measuring the junction temperature in power cycling tests (especially for AC-). The results reveal that a stable and accurate measurement result can be achieved without influencing the converter’s normal operation. In the final article, more details of the optical fiber implementation and lifetime estimation using junction temperature data will be provided.
Acknowledgment
This work is funded by the X-POWER project from Danish Agency for Science and Higher Education. The authors would like to thank J. Christiansen, M. Lund, B. B. Jensen for their support in the setup implementation.