Facebook
 Google
 GitHub
 Linkedin
New Tool Calculates Digital Data’s Carbon Footprint
A tool developed by researchers at U.K.-based Loughborough University helps businesses measure carbon dioxide emissions tied to their data projects.
A calculator released by researchers from Loughborough University in the United Kingdom measures the stage-by-stage carbon dioxide (CO2) output of data projects from the point the information is created to its end use.
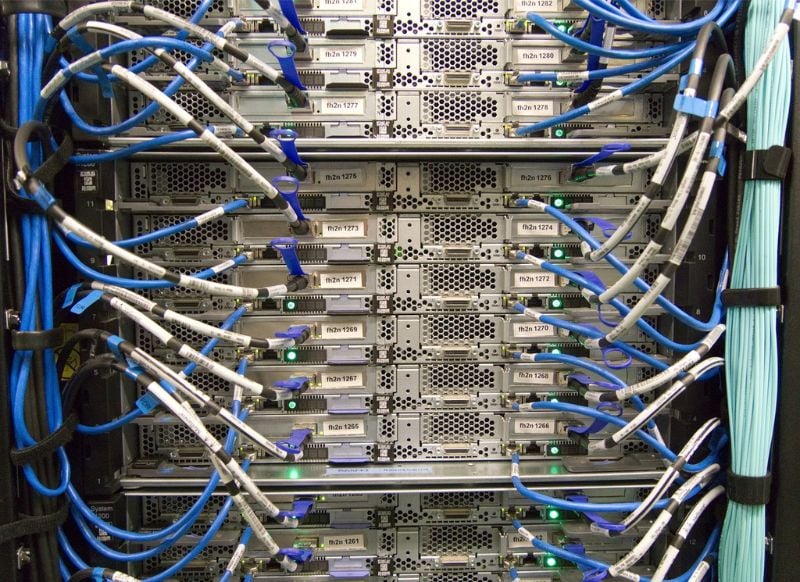
Digital data center. Image used courtesy of Pixabay
The developers tout the tool as the first publicly available calculator measuring the CO2 footprint of data across its typical journey. The web-based tool is free to use and centers around two factors: the second-by-second rate of data generation and the amount of CO2 emissions produced by the data.
An editorial in Knowledge Management Research & Practice expands on the calculator’s utility in helping companies and organizations rethink their approach to data management amid the ongoing global migration of data to cloud storage applications.
One of the calculator’s creators is Tom Jackson, a professor of information and knowledge management at Loughborough University’s Business School, who said in a statement that the tool is unique because it measures impact at every point along the data’s lifetime, not just the last stage. Jackson likened it to a mechanic meticulously analyzing every part of a car to gauge its carbon footprint, including its tires, body shape, engine, and driving metrics.
Co-researcher Ian Hodgkinson added that digital technologies are critical in the global transition to clean energy resources and meeting net-zero emissions targets. Stakeholders should be aware of the hidden CO2 footprint costs attached to how societies and organizations use these technologies.
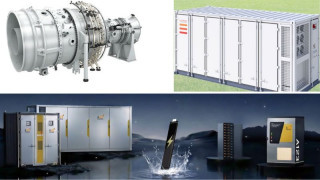
Researchers from U.K.-based Loughborough University have released a free calculator for businesses and organizations to calculate the cost of carbon emissions from their data. Image used courtesy of Loughborough University
Data’s Sizable Role in Global Emissions
Global digital data generation, capture, copy, and consumption is projected to reach a whopping 180 zettabytes by 2025, according to Statista. Jackson and Hodgkinson estimated that this translates to over 6.8 billion years of continuous, high-quality video streaming on Netflix. The 2025 projection would be a significant jump from a record-breaking high of 64.2 zettabytes in 2020, amid the rise of data generated by employees working from home and increased streaming/entertainment activities in the COVID-19 pandemic.
These trends also stem from the skyrocketing adoption of IoT devices, from smart watches and appliances to home security systems, connected thermostats, and smart TVs. But consumers are just one piece of the equation. On average, more than half of the data generated by companies is “dark data,” information that’s collected, processed, and stored for routine business practices but largely remains unused after that, according to a global survey by Splunk.
The tremendous growth of cloud storage systems further adds to the carbon footprint, currently accounting for 2.5% to 3.7% of greenhouse gas emissions worldwide and surpassing commercial aviation (2.4%), according to a 2022 analysis from carbon measurement software company Climatiq.
Data center emissions are typically traced back to three factors: the electricity consumption to operate the servers, water consumption to cool them, and the equipment’s lifetime. The International Energy Agency (IEA) reports that data center outputs have increased only modestly since 2010, tracking with various energy-efficiency improvements, renewable energy purchases by IT/communications companies, and decarbonized electric grids. But still, emissions must be cut in half by 2030 to meet net-zero targets.
‘Data Carbon Ladder’ Estimates CO2 Footprint in New Data Projects
In addition to the new carbon emissions calculator, the Loughborough University researchers have devised a “Data Carbon Ladder” framework to help companies/organizations diagnose their carbon footprint from data acquisition to every point along the ensuing journey. It’s a sequential process to be completed by data engineers, managers, or other analysts.
The ladder begins with the acquisition of external knowledge. Next, the assimilation of the data focuses on how it will be (dis)aggregated in line with three possible options: The user imports the new dataset, thus creating a copy adding to the carbon footprint; the user opts to keep the external data on a host server and access it remotely, which reduces the carbon footprint; and the new data can be aggregated with other datasets if required for the task.
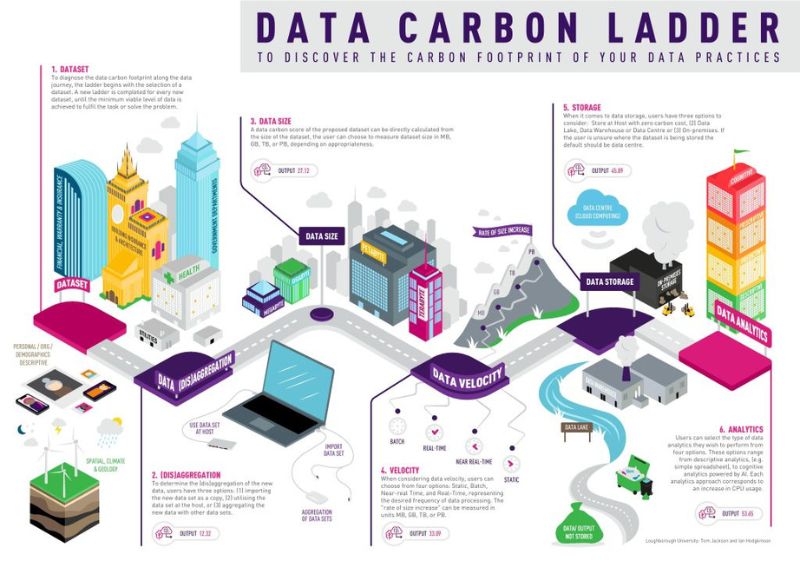
The different processes in the Data Carbon Ladder. Image used courtesy of Loughborough University
Next, the data transformation process measures the degree of data velocity with four options: real-time data gathered, processed, and analyzed continually and available for use after being created; near real-time data offering a snapshot of historical data; batch data, processing a large volume of data simultaneously; and static data, a fixed dataset that remains unchanged after its collection.
Then comes exploitation of the data, focusing on how the data is stored either through a host server, a data center via the company’s shared operations and equipment or on-premises storage on local hardware. Four options apply here so the user can select the type of data analytics to be performed: Descriptive (historical assessment to identify patterns), predictive (likely scenarios), prescriptive (using graph analysis, recommendation engines, simulation, and other analytics methods), and cognitive (applying human intelligence to tasks via AI algorithms, semantics, and deep and machine learning).
Video used courtesy of Loughborough University
Jackson and Hodgkinson wrote in Knowledge Management Research & Practice that the ladder should be repeated for each new data source selected until the task, request, or minimum viable product is complete. Then, the scores of each new source can be combined for an overall CO2 emissions score, enabling organizations to gauge data-linked carbon levels at various stages.
Four-Part Toolkit
The calculator and ladder tools represent two offerings in a four-part toolkit.
The researchers plan to launch a “Data Carbon Scorecard” tool at an event in London on June 26. The scorecard consists of nine questions and generates an outcome in green, amber, or red, with varying levels of environmental impact and potential alternatives to reduce emissions.
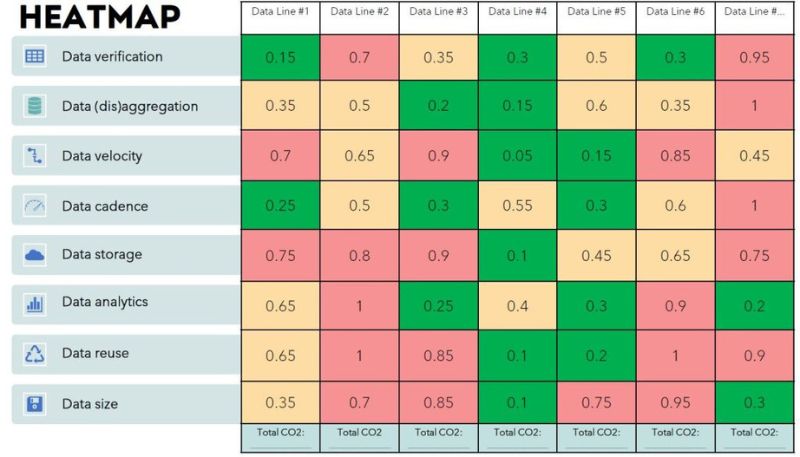
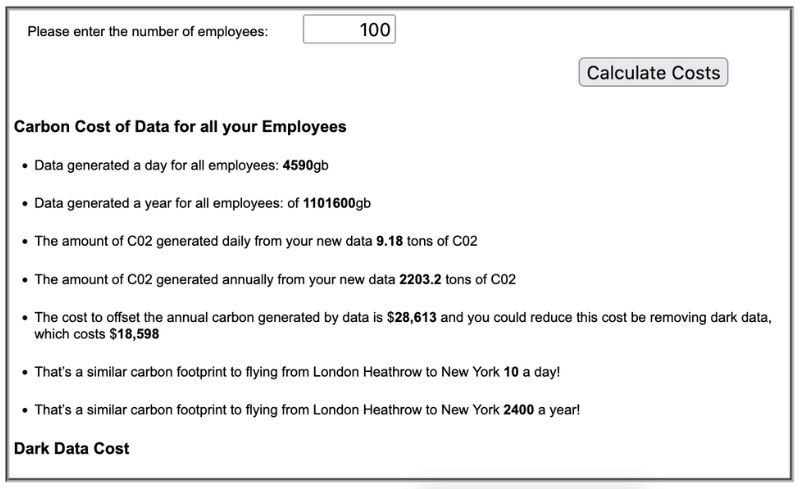
CO2 data heatmap. Image used courtesy of Loughborough University
A separate heatmap visualization tool (see the image above) displays data-associated CO2 hotspots in a traffic light display, offering a line-item measure of carbon emissions and benchmarking performance.