Facebook
 Google
 GitHub
 Linkedin
Geospatial Analytics Gives Utilities a Bird’s Eye View into New Profits
Learn how geospatial analytics, using satellite imaging and AI, helps utilities track new construction, detect leaks, manage vegetation, and boost sales, saving costs and improving efficiency.
Commercial construction is booming nationwide. Austin is seeing an increase in commercial permits for data centers and offices for high-tech and life sciences startups. Phoenix is seeking a boom in building for industrial and logistics companies. Raleigh-Durham is experiencing a surge in construction to accommodate life sciences and research and development (R&D). Dallas-Fort Worth is also witnessing an increase in mixed-use and industrial development.
All these construction projects have one thing in common—the need for utility services.
An ongoing challenge for utility companies is keeping up with new service requests, so nothing falls through the cracks. When a contractor misses a service request, it can delay hookups for weeks or months, resulting in construction delays, frustrated customers, and deferring service revenue. For example, pulling service requests for one Phoenix subdivision forward three to four weeks means an added $90,000 to cash flow.
Rather than risking service delays and lost revenue, local distribution companies (LDCs) like Duke Energy’s Piedmont Natural Gas unit are using satellite imaging and geospatial analytics to track new construction and proactively work with developers to ensure timely service installations.
Bird’s Eye View of New Construction
Using satellites to monitor new construction from 270 miles up provides LDCs with a bird’s-eye view of new construction projects, allowing them to determine when they are ready for new service hookups.
Piedmont Natural Gas has been using multispectral imaging for some time. Initially, the company contracted with Satelytics for quarterly reports to measure methane emissions. Measurement was so successful that Piedmont Natural Gas began receiving regular satellite assessments to track construction starts, enabling them to pinpoint when to initiate service.
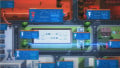
Using algorithms powered by artificial intelligence (AI), construction sites are classified as “graded,” “foundation,” “framed,” or “roofed” (Figure 1). Utilities should typically be connected after the walls go up, in other words, when the buildings are framed.
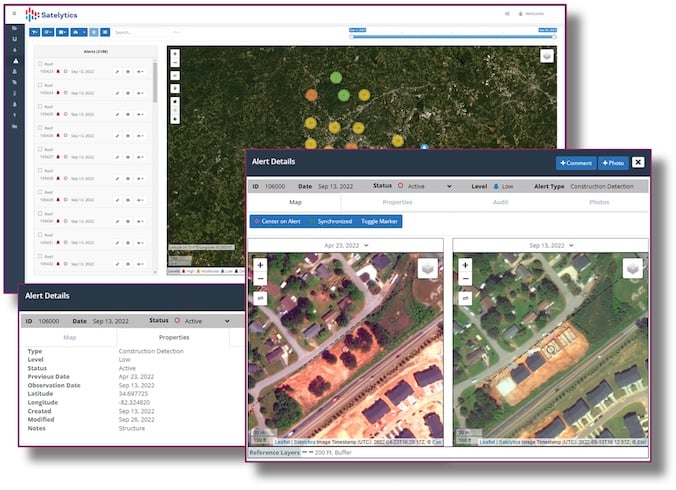
Figure 1. By applying Al-powered algorithms to visual images, construction sites are classified as “graded,” “foundation,” “framed,” or “roofed.” (Click on image to enlarge)
Geospatial analytics starts with hyperspectral data from different sources, including satellite imaging (both conventional and nano-satellite arrays), aerial imagery from drones and planes, and data from camera platforms. Remote sensing technology (RST) acquires data from sunlight and other rays in the electromagnetic spectrum reflected from surfaces and captured by aerial sensors.
The raw data from the RST sources is collected for analysis using complex, machine learning algorithms to isolate spectral signatures. AI and machine learning make it possible to process petabytes of imaging data collected from thousands of aerial and satellite images.
RST-GA uses spectroscopy to target different areas of interest, such as hydrocarbon leaks, geohazards, vegetation encroachment, and right-of-way issues. Multispectral imaging can also identify new construction sites and track building progress. The extracted spectral information is also used to run predictive models and for interactive displays, alerts, and visualizations.
Spectral Satellite Imaging: More Accurate, Less Cost
Spectral satellite imaging is more accurate and less expensive than other “windshield” surveys. It costs more than $1,000 per dispatch to roll a utility truck, which makes it costly to send our crews to check construction sites. Satellite monitoring reduces survey costs to a fraction of those incurred through windshield surveys.
Satellite imaging companies, such as Planet Labs, Maxar Technologies, and Airbus, continuously map and monitor the Earth’s surface, delivering pixel-precise images ranging from a few meters wide to the size of a dinner plate. With such high-resolution satellite images, AI-powered analytics can track and classify the construction progress. Business logic triggers the direct push of tickets to the utility’s Customer Information Systems/Outage Management System (CIS/OMS), allowing for proactive targeting of construction sites for connections and metering.
Commissioning private companies to “task” satellites to focus on target areas is more efficient than using continuous imagery from government satellites. Not only is the resolution substantially higher, but images are delivered for analysis within hours. Alternative aerial imaging strategies, such as drones or fixed-wing aircraft, are considerably more expensive and can take days or weeks to deliver images for AI processing.
Improving Imaging Interpretation
Combining satellite images with geospatial analytics unlocks actionable insights from massive datasets. Using machine learning and AI-based software to interpret spectral images enables the detection of construction project status, vegetation encroachment on power line corridors, methane leaks, and other operational and environmental issues (Figure 2).
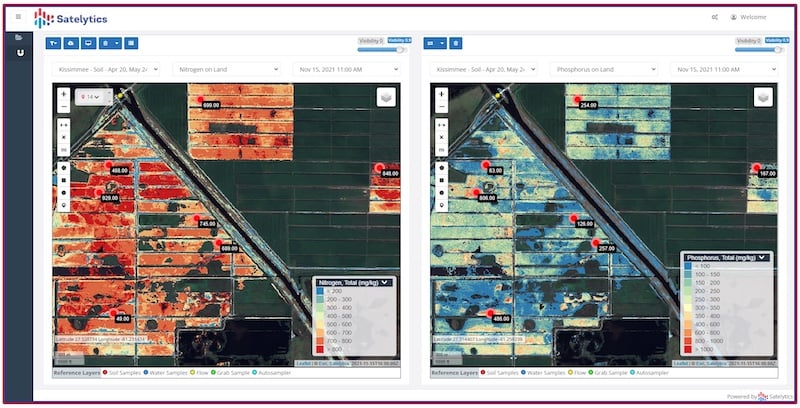
Figure 2. Using machine learning and AI-based software to interpret spectral images enables the detection of chemicals. (Click on image to enlarge)
AI-powered geospatial analytics provides highly accurate information that utilities can utilize in various ways. For example, a geographic analysis can show changes in land use, land movement, and surface temperatures. Spectral chemical analysis can detect liquid hydrocarbon leaks, methane leaks, acid mine drainage, phosphorus, and chloride. Spectral analysis can also detect metals and toxic substances, such as arsenic, barium, calcium, copper, iron, and magnesium.
Satellite images can also be utilized for biological analysis in vegetation management, including assessing tree density and height, vegetation classification, and evaluating vegetation health, among other applications. The objective is to use AI analysis of satellite images to create actionable intelligence. For example, spectral analysis of vegetation encroachment can identify areas where trees pose a threat to power lines and even detect unhealthy foliage that is likely to cause problems.
Relying on orbital images alone isn’t enough. Satellite spectral analysis must initially be validated using “ground truthing.” For instance, field teams equipped with backpack spectrometers may be dispatched to verify a methane leak. Field measurements are compared with analytics to calibrate satellite spectrometry and adjust AI algorithms. After initial ground truthing, machine learning is then used to continually improve the accuracy of the findings.
Over time, AI algorithms are trained to distinguish between what satellites see, such as differentiating between water and crude oil for pipeline leak detection, identifying a sugar pine instead of a maple tree, and accurately measuring natural gas leaks on local distribution systems. Using AI-powered applications and machine learning, satellite imaging analytics achieve an accuracy rate exceeding 90%.
Turning Imaging Data Into Action
Utilities continue to find new applications for AI-powered satellite surveys. For example, Piedmont Natural Gas is expanding its use of satellite analytics to boost sales of natural gas. Using satellite imaging, Piedmont can identify propane tanks in rural areas and see if it’s practical to replace standalone tanks with natural gas lines.
Companies are also using geospatial analytics to drive business processes. Microsoft Dynamics 365 can use satellite data to manage workflows and closeouts. IBM’s Maximo platform can use the data to generate risk matrices and work orders. Analytics output can trigger alerts in SAP to initiate work permits and in Oracle to manage truck rolls. Risk thresholds and customized alert parameters can also be set based on satellite data.
Geospatial analytics are transforming how energy companies manage infrastructure, identify new revenue opportunities, and minimize environmental impact. Energy companies are saving money and increasing efficiency by using satellite images rather than dispatching field teams to conduct ground surveys. Utilities can act more efficiently, lower operating costs, minimize environmental impact, and enhance customer satisfaction. Thanks to geospatial analytics, LDCs are becoming less reactive and more proactive business partners.
All images used courtesy of Satelytics