Facebook
 Google
 GitHub
 Linkedin
Thermal Endurance Estimation of Magnetic Components Used in Embedded Automotive Applications
This article reviews the common definitions of temperature stated for an insulating material to have an idea of its resistance to heat versus time.
Over the years, there has been considerable debate on how to determine and classify the thermal performance of insulation materials used in electrical power systems equipment and their related applications.
Unfortunately, there is a tremendous amount of confusion in the marketplace regarding the thermal performance of insulation materials. There are many terms used to describe thermal performance, including Relative Temperature Index, Thermal Classification, Continuous Operating Temperature, and others. However, as a customer of a branded material or a supplier which must provide reliability guarantees, it is important to ask and understand what is being supplied! This is of even more importance for power electronic equipment embedded in new hybrid or electric vehicles, such as onboard battery chargers, DCDC converters, inverters, electrical motors, and the like. As a matter of fact, the constant target of a higher power density at a lower weight, lower volume, and at a lower cost, really pushes the components to their limits in regard to their operating temperature versus the thermal resistance of any polymer material from their structure.


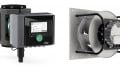
Figure 1: Excess of heat can lead to electrical breakdown of power components
In this article, we will present and discuss the common possible definitions of the temperature limits given for any relevant material part of the insulation system. We will present the description of certified test methods, as well as how the results can be used for the thermal endurance estimation of a device. One example related to an inductive component will be presented considering some real mission profiles that can be found in automotive applications. A tool to estimate the “lifetime consumption” of the insulation during the mission profile will be shown and commented on.
Definitions
Without question, there are many terms used to describe the thermal performance of materials. Unfortunately, some of these terms have no technical meaning established by industry standards or specification. For example, there is no industry definition or standard for “Continuous Operating Temperature”. What does that term mean? How is it tested? How does it apply to design considerations for electrical equipment? A property value for Continuous Operating Temperature really has no meaning unless there is a very specific test method indicated to help determine how that property value was determined.
It is safe to say that each industry may have its own terms and its own test methods for determining the thermal performance of various materials used in its designs. However, the electrical industry has established very specific terms and test methods pertaining to rigid electrical insulation laminates.
In the electrical industry, the terminology referring to the thermal characteristics of insulation materials can sometimes be confusing because several terms are used interchangeably. The following most common definitions today should help clarify this:
a) Thermal Endurance
Defined as the relationship between temperature and the time spent at that temperature required to produce such degradation of electrical insulation that it fails under specified conditions of stress, electric or mechanical, in service or under test (IEEE Standard Dictionary of Electrical and Electronic Terms). The point of failure, also referred to as the “thermal life," is typically considered as the time at which the measured property falls below 50% of its original untreated value.
b) Relative Temperature Index (RTI)
IEEE Definition:
An index that allows relative comparisons of the temperature capability of insulating materials or insulation systems based on specified controlled test conditions (IEEE Standard Dictionary of Electrical and Electronic Terms).
UL Definition: The temperature above which the material is likely to degrade prematurely. This temperature can be determined by performing a thermal aging comparison against a material known to have an acceptable performance at a known temperature. The RTI can also be simply assigned based on the known performance of the generic class of the material.
One of the most important tests to determine a given plastic’s fitness for long-term ambient heat is the UL Standard 746B, “Polymeric Materials - Long-Term Property Evaluation”. Underwriters Laboratories Inc. (UL) developed RTI to test the deterioration of insulating materials in electrical devices over time. Maximum service temperature for a material where a class of critical property will not be unacceptably compromised through chemical thermal degradation. This spans over the reasonable life of an electrical product, relative to a reference material having a confirmed, acceptable corresponding performance defined RTI.
-
RTI electrical: The electrical RTI is associated with critical electrical insulating properties by measuring dielectric strength.
-
RTI mechanical impact: The mechanical impact RTI is associated with critical impact resistance, resilience and flexibility properties by measuring tensile impact strength.
-
RTI mechanical strength: The mechanical strength (mechanical without impact) RTI is associated with critical mechanical strength where impact resistance, resilience, and flexibility are not essential by measuring tensile strength.
Where to find the RTI for a material? Underwriters Laboratory has tested many materials for RTI and they report these numbers on what they call the UL “Yellow Card” of the material (Exxxxx number). You can find these on the UL Prospector website. Here is an example of one for a well-known PA66 plastic:

Figure 2: Example of the UL “Yellow Card” for FR50 PA66 plastic material
The RTI values are listed under the thermal section of the card, usually under columns. The RTI numbers are divided into RTI Elec (electrical properties), RTI Imp (impact strength), and RTI Str (tensile strength). You might have to decide what the most important property is. If all three are critical, then use the lowest RTI figure.
You will also notice that many materials have different thicknesses listed under each category such as 0.35, 0.75, 1.5mm… This represents the thickness of the tested plaques. Usually, thicker sections can take more heat. Look at the RTI that corresponds to the thinnest section of your part.
Such a value for RTI will be also specific to a particular grade of a polymer, sometimes even to a specific color. The difference between grades of a particular species of a polymer can be substantial, depending on both on the variation in the inherent stability of material between different manufacturing methods and also on the type and amount of additives used. It is possible to obtain from the laboratory a Generic Temperature Index to cover a species of material, but this will usually be considerably lower for many of the individual grades within that species.
Today, the Relative Temperature Index is widely accepted by the electrical industry when determining the thermal performance of a material. As seen in the previous definitions, the RTI value can be determined by methods ranging from long-term thermal aging studies to simply assigning values based on the generic class of the material (after chemical analysis to confirm a material belongs to a certain class).
c) Temperature Index (TI)
ASTM Standard D2304:
A number that permits comparison of the temperature/time characteristics of electrical insulation material, or a simple combination of materials, based on the temperature in degrees Celsius which is obtained by extrapolating the Arrhenius plot of life versus temperature to a specified time, usually 20.000 hours. The international standard IEC 60085 gives the table as below for reference where an added column shows examples of corresponding materials per thermal index.
| Temp. (ºC) |
Therm. class |
Related Materials |
| 90 | Y | organic materials e.g. paper, wood, cotton, silk together with conventional integrating compounds (shellac, asphalt, oils), from the group of polymers PVC |
| 105 | A | organic materials e.g. paper, wood, cotton, silk, fabric together with a suitable impregnant or enamel, cellulose-based synthetic material, press boards for electrical purposes, paper-based adhesive tapes, acrylate combined with paper, PET foil with caoutchouc, PES fabric or tape, hardened cotton fabric with phenolic resin |
| 120 | E | organic materials e.g. cellulose or hardened paper, hardened fabric, cellular tissue in combination with impregnants or phenol-formaldehyde or phenolic resin, hardened paper and fabric with phenol-formaldehyde, pressed phenol melamine laminate, PET foil with electrical press boards |
| 130 | B | inorganic materials e.g. glass fibers, glass laminate with epoxy binder, mica based insulation, PES resin with glass mat, PET/caoutchouc and PET/acrylate-based adhesive tapes |
| 155 | F | components of these materials are glass fibers, mica paper, PET, PEN foils, aramid and its modifications (nomex, kevlar, twaron) aramid paper, epoxy and novolac resins |
| 180 | H | silicone and modificated epoxy resin is used as a binder, aramids, polyimide, PES, mica, mica paper and its modification (remca, samica, calmica) and its composites |
| 200 | N | glass, asbestos (banned), aramid papers with silicone binders, teflon, polyester-alkyd based impregnating enamel |
| 220 | R | same as class N materials, glass fibers, asbestos (banned), aramid papers mostly with silicone bindings, aromatic polyamide |
| 250 | 250 | polyimides (kapton), aramids (nomex), PTFE, class R materials with new binding materials, polyimide foils |
Figure 3: Table of thermal index according to IEC 60085
d) Other temperature characteristics of polymers
Additional temperature parameters can be under the scope for plastic materials selected for use in one application.
Melting temperature (Tm):
The temperature at which a substance changes from a solid to a liquid state.
Glass Transition Temperature (Tg):
The glass-liquid transition, or glass transition, is the gradual and reversible transition in amorphous materials (or in amorphous regions within semi-crystalline materials) from a hard and relatively brittle "glassy" state into a viscous or rubbery state as the temperature is increased. An amorphous solid that exhibits a glass transition is called a glass. The reverse transition, achieved by supercooling a viscous liquid into the glass state, is called vitrification. So, the glass-transition temperature Tg of a material characterizes the range of temperatures over which this glass transition occurs. It is always lower than the melting temperature, Tm, of the crystalline state of the material, if one exists.
Temperature of Degradation (Td):
The temperature at which the material weight changes by 5%. This parameter determines the thermal survivability of the resin material. Issue: material decomposition can result in adhesion loss and delamination. The chemical bonds break upon exceeding Td resulting in permanent degradation and damage to the material.
Heat Deflection Temperature (HDT):
The temperature at which a polymer or plastic sample deforms under a specified load. This property of given plastic material is applied in many aspects of product design, engineering and manufacture of products using thermoplastic components.
Vicat Softening Temperature (VST):
Is the determination of the softening point for materials that have no definite melting point, such as plastics. It is taken as the temperature at which the specimen is penetrated to a depth of 1mm by a flat-ended needle with a 1mm² circular or square cross-section. For the Vicat A test, a load of 10N is used. For the Vicat B test, the load is 50N.
Even if all those physical properties may have some meaning, they do not provide for any reasonable estimation of the life of an electrical insulation material based on mechanical or electrical property retention at a certain temperature over a period of time.
That’s why these tests are not referenced in any IEEE, UL, NEMA or ASTM test method for electrical insulation materials. However other standards describe their testing method, like for example the IPCTM-650. In the electrical industry, there are no other widely accepted terms that define the thermal performance of a material based on an accepted test method for electrical insulation materials. Remember that other industries may have their own standards for defining terms such as “Continuous Operating Temperature”, but unless a specific test method is referenced, such terminology has no real technical meaning.
Testing Methods
Today, the Relative Temperature Index is widely accepted by the electrical industry when determining the thermal performance of a material. As seen in the previous definitions, the RTI value can be determined by methods ranging from long-term thermal aging studies (for up to 60.000 or 100.000 hours) to simply assigning values based on the generic class of the material (after chemical analysis to confirm a material belongs in a certain class).
The test programs and methods for the determination of thermal performance of insulation materials were developed based on the assumption that heat is the chief cause of insulation degradation. Other factors being equal, thermal degradation is accelerated as the temperature is increased and other mechanical and electrical properties deteriorate with increasing temperature over time.
To simulate the thermal response and determine the RTI of a material, the test specimens are aged in a load-free state at different temperatures in forced-ventilated hot-air cabinets. The change in specific properties in relation to the aging period can subsequently be calculated at room temperature.
These property changes are generally investigated by means of a mechanical shock test, quasi-static and electrical measurements. The test ends when the property value in question falls below the minimum threshold (50% of the original value).

Figure 4: Determination of the time to reach the end-point at each temperature – Property variation
The time until the property limit is reached is calculated for each individual property (temperature/time pairs) based on the results obtained. Those pairs are then used to generate a thermal resistance diagram for the material being tested. By extrapolating the results over time, a temperature index (TI), normally after 20.000 hours, can be determined according to (IEC) DIN EN 60216-1.

Figure 5: Long-term thermal resistance diagram for different physical properties
For a full aging study, thermal performance at a minimum of three and preferably four temperatures would be tested. ASTM recommends choosing the lowest temperature test to be less than 25°C above the hottest-spot temperature expected in use so that the thermal life is at least 5.000 hours. Select the highest temperature so that the thermal life is at least 100 hours. If possible, the aging temperatures should differ from each other by at least 20°C, but 10°C increments remain acceptable.
The linear regression of the plot gives the Halving-Interval Coefficient (HIC) corresponding to the numerical value of the temperature interval (in Kelvins) which expresses the halving of the time to end-point taken at the temperature equal to TI. In the below example we can deduce TI # 130°C and HIC # 5 to 6K.

Figure 6: Lifetime characteristic under long-term thermal stress – Thermal endurance graph (Arrhenius plot) according to IEC 60216-1
From experiment and data from suppliers, we find HIC values around 5-15K for most of the insulating materials. According to ASTM D2304, “Experience has shown that the thermal life is approximately halved for a 10°C increase in exposure temperature”.
Composites - Example of enameled wires
Many insulators are composites using adhesives and varnish. They are used as test samples following a simple varnish treatment. For example, the helical-coil method is a life testing method for impregnated varnish. By winding a bare copper wire densely to form a cylinder, impregnating and coating the varnish and drying/sintering it to make a test sample, its bending breakage stress after heating can be determined and the thermal degradation rate can be checked simply.
Another example is the method in which varnish is impregnated in glass cloth and dried to make a varnish glass cloth for use as a test sample, and the breakdown voltage is then determined following thermal degradation. Another is the twisted-pair method, in which a test sample made of two twisted enamel wires is used to determine the dielectric strength by applying a high voltage (DC or AC 50Hz) between both wires. Meanwhile, the heat resistance of laminated materials can be examined easily by using a test sample of an appropriate size to conduct a bending test or tensile strength test.
Thermal Endurance Estimation for Inductive Components
The above paragraphs discuss the thermal resistance of insulators fully used in power electronic systems. At component levels like transformers or inductors, we have now to consider the assembling of those in a common structure. Electrical Insulation Systems (EIS) certified by the UL exist and must be mentioned. These are systems in which the designer can choose the plastic parts to be in accordance with a given thermal class of the end-product (B, F or H). If the selection can be out of such a list, the lowest insulating plastic material must be considered as the weak point.

Figure 7: Arrhenius plot for different enamel wires (UEW/130°C, UEW-F/155°C, UEW-H/180°C… AIW/220°C)
The question is then to know if the temperature reached by the insulating elements might reduce the expected lifetime of the product (if the temperature will be higher than its thermal class) or, on the opposite, increase its reliability (case of lower temperature than the thermal class).

Figure 8: Isolated flyback transformer construction
For the following study, let us consider an isolated flyback transformer designed for a 35W/100kHz switch mode power supply used in an inverter module of an electrical motor (xEV application). Its primary will be connected to the high voltage battery side (200-450Vdc) whereas the secondary low output of 17V/2Adc must be fully isolated at a basic level according to IEC 61558-1/-2-16. To provide such isolation, a creepage distance of no less than 8mm must exist. It is done by using triple-insulated wire (TIW) in all windings and a special coil-former to provide enough distance between pins and core.
The constitutive elements can be described as in the below table including thermal information like TI and HIC values. The TI number comes from the UL “Yellow Card” of the material (thermal RTI data) or classification according to the IEC 85. The HIC is given as a typical value for the material. The user normally needs to contact the supplier of the plastic to get such data not so often described in standard specifications. From this table, we determine that the weak point can be the wire insulation which is of the lowest thermal class (F/155°C). The coil-former is at the same level but might suffer less from the heat than the wire carrying the current and therefore subjected to frequency effects.

Figure 9: Constitutive parts and thermal properties of the transformer’s elements
As predicted by theory and experience, the transformer hotspot is located in the middle of the winding and close to the air-gap due to both proximity effect between winding layers and fringing flux out from the gap. The below result shows the heating at a different location and under worst-case operating conditions in the equipment. The component is originally placed in an oven set at 90°C and cooled by forced convection by an oven fan. After approx. 30min of stabilization, the oven and fan are switched off and the temperatures increase as there is no forced convection anymore. After another 30min we can read the reached temperature, in a context like the real case in the inverter power supply unit. The plotted Eq Temp are from the correction: Eq Temp(t) = Measured Temp(t) – Ambient Temp(t) + 90°C.


Figure 10: Thermal behavior of the transformer under test at different locations
As far as we can see, the hotspot inside the winding (curve no. 2.) can reach up to 160-165°C at the end of the test. Does it mean that the isolation of the wire stated at F/155°C class is not enough? The only way to properly answer this question is to have an idea of how long this worst-case condition will apply during the whole life of the product. That’s why it is often better to know a mission profile related to the application. The (automotive) customer can normally share this information in a chart as below at least as an estimation level of the mission.
From this example related to the studied transformer, we can notice that finally, the exposure to high temperature over the thermal class of the system is only a few hundreds of hours (800 hours) in contrast to the total mission of approx. 53.000 hours.

Figure 11: Example of mission profile (utilization vs. estimated maximum temperature)

Figure 12: Distribution of temperature vs. estimated utilization
Additionally, since the reference time for the TI is 20.000 hours, the total duration of 53.000 hours must also be considered as a possible failure mode. The method proposed here refers to the IEC 60216 standard to estimate the global Consumed Endurance Potential (CEP). The CEP is firstly calculated at every temperature step of the mission profile according to the Arrhenius law. Only the TI and HIC values are needed to deduce the A and B coefficients. The thermal Endurance in Continuous Operation (ECO) can then be deduced from them.

Figure 13: CEP calculation from the known mission profile and (TI,HIC) data from the material

Figure 14: Applied formulas and definitions in the proposed method
The global CEP is calculated at the end as the sum-up of the contributions at all temperature and from it, we can calculate back what would be the life expectancy for the material under study. The results for the insulation of our flyback transformer is 12%, so, approx. 440.000 hours of operation for the given mission profile. With a total expected operation of 53.000 hours only we can easily conclude that there is definitively no danger for the product made of an F class insulation system even if it can reach higher temperatures than 155°C for a certain period of time and runs for more than 20.000 hours during the total lifetime. As a safety rule, it is considered that a total CEP of no more than 10-20% is fully safe for the insulating system not to suffer from degradation during the mission.

Figure 15: Fully finished unit with integrated CoolMagTM compound encapsulation

Figure 16: CoolMag28TM characteristics from KADION (1.5W/mK)
Conclusion
This article reviews the common definitions of temperature stated for insulating material to have an idea of its resistance to heat versus time. The Thermal Index (TI) or Relative Temperature Index (RTI) values are the most used as a reference at 20.000 hours. The given lifetime expectancy almost always considers a drop of 50% of the characteristics under study (electrical or mechanical properties). UL 746B, IEC 60085 and ISO 60216 are the identified standards to deal with this approach.
For magnetic components, the mix of different insulators must be considered, always relying on the lowest thermal class index of each of them. A method based on the Arrhenius law was presented to be able to perform calculations of the life expectancy for a given mission profile. The Halving-Interval Coefficient (HIC) must be known from plastic suppliers as a given, in its role as an independent variable. According to the result as total Consumed Endurance Potential (CEP), a conclusion about the compliance of the insulating system regarding the mission profile can be drawn.
This approach is even more useful when developing electrical power components for the automotive sector (xEVs) for which heating and lifetime are the main parameters for design optimization in terms of sizing and level of loss acceptance.
About PREMO - Perspectives
PREMO is a Spain-based company engaged in the development, manufacture, and sales of electronic components with a special focus on the growing market of xEV, smart metering and market segments including automotive, telecommunications and industrial electronics. Our product portfolio includes NFC and RFID antennas, power transformers, inductors and chokes, current sensors, EMC filters, PLC components, and accessories. In addition to our broad range of standard components, off-the-shelf products, PREMO designs custom solutions to fit customer requirements
For power magnetics embedded in OBC or DCDC converters, the size reduction is a must which leads to more heat generated by more losses in a smaller volume. To guarantee the reliability of the parts over the lifetime, the cooling efficiency of the solution has become a key factor.
For recent years PREMO has been testing many thermal conductive resins and compounds (more than 30 different formulations in fact) to try to optimize the performance-to-cost compromise. Of course, such additives will also help in the mechanical fixing and isolation of the part in the application. The goal was to find the best mixing to offer the most competitive solution.
After massive investment and research in the field, today PREMO uses and recommends the CoolMagTM resin references developed in collaboration with KADION Spanish company which show the best compromise between thermal as well as mechanical performances and cost.
About the Authors
Patrick Fouassier, Engineer degree, and PhD. in electrical engineering, has more than 20 years of experience in magnetic components related to signal and power electronics. He studied at Grenoble INPG/ENSE3 engineering school and did his thesis in G2ELab close to the Alps. After his prior position as R&D Manager at MICROSPIRE (now part of EXXELIA Group), a French company oriented towards professional markets like defense, avionics, and space, he joined the Spanish PREMO Group in 2008 when participating in the creation of the PREMO FRANCE office located in Grenoble area. Now his activity within his team is fully focused on the development and project management of innovative solutions for the automotive sector with components for battery chargers and DCDC converters from some kW to tens of kW used in new electrical and hybrid cars. His R&D expertise is on a worldwide scale and in a fully multicultural context from customer technical support to internal training.
Abdelkader Birch, Engineer degree in electrical engineering, has more than 11 years of experience in magnetic components related to power electronics. He studied at Grenoble INPG/ENSE3 engineering school from where he got his electrical engineer degree. Previous position: 8 years of experience in the design of magnetic components for railways applications in the company TRANSRAIL BOIGE & VIGNAL He joined PREMO Group in 2016 to develop magnetics within the R&D team of PREMO FRANCE. His activity is focused on the development and project management of innovative solutions for the automotive sector with components for battery chargers and DCDC converters from some kW to tens of kW used in new electrical and hybrid cars. His expertise in thermal endurance approach and lifetime calculation is fully thanked here for the application to the presented flyback transformer case.