Facebook
 Google
 GitHub
 Linkedin
Measurement of Loss in High-Frequency Reactors: Method for Measuring and Analyzing Reactors (Inductors) Using a Power Analyzer
This article introduced a method for measuring and analyzing high-frequency reactor loss, with reference to an actual measurement example.
Introduction
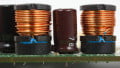
High-frequency reactors are used in a variety of locations in electric vehicles (EVs) and hybrid electric vehicles (HEVs). Examples include step-up DC/DC converters between the battery and the inverter and AC/DC converters in battery charging circuits. To boost overall system efficiency, it is necessary to improve the efficiency in each constituent circuit, and reactors are one component that is responsible for a large amount of loss in these circuits. Consequently, accurate measurement of reactor loss is an essential task in improving overall system efficiency. In general, because most of these reactors are switched on and off at high frequencies, conventional wisdom holds that it is difficult to directly measure reactor loss. In the past, elements such as IGBTs were used as switching elements, and switching frequencies were on the order of tens of kilohertz. In recent years, progress in the commercialization of SiC and GaN elements has made possible switching frequencies greater than 100 kHz, spurring demand for measuring instruments with high-frequency bands. This paper describes a method for measuring reactor loss with a high degree of precision, with reference to an actual measurement example.
Reactor loss
Figure 1 illustrates an equivalent circuit for a reactor, which can be thought of as a circuit with an inductance component Ls connected in series with the resistance Rs, representing loss.
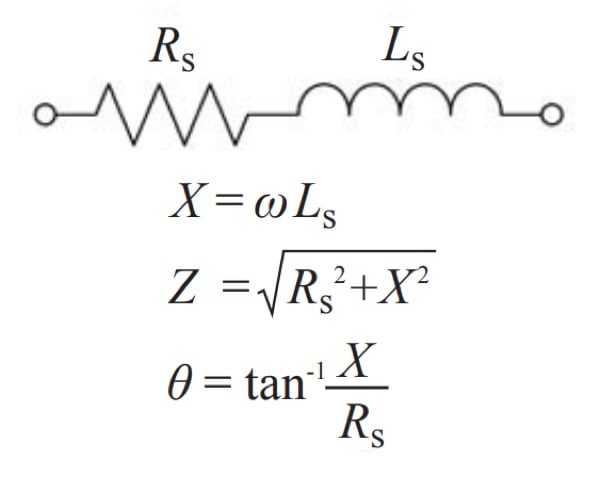
Figure 1: Equivalent circuit for a reactor
The equivalent circuit’s Ls and Rs can be measured using a standard LCR meter. In such a scenario, the LCR meter will apply a minuscule sine-wave signal to the measurement target and measure the impedance. By contrast, the characteristics of a reactor in an operating circuit will differ from a measurement made with an LCR meter for the following reasons:
- A rectangular-wave voltage will be applied to the component as a result of the switching operation. This will cause a triangular-wave current to flow, with the result that neither the voltage waveform nor the current waveform will take the form of a sine wave.
- Due to the characteristics of the component’s magnetic core, each parameter will exhibit level dependence. This dependence will cause quantities such as Ls and Rs during component operation to differ from the values obtained by measurement with an LCR meter.
- During use of a DC/DC converter, the current applied to a reactor will exhibit DC superposition. The parameters during such superposition differ due to the magnetic core’s saturation characteristics.
In short, high-precision measurement of reactor loss and parameters must be carried out not with an LCR meter, but rather while the component is in an operating state.
Method for measuring reactor loss
Figure 2 provides a measurement block diagram during measurement of reactor loss using a boost chopper circuit as an example. In this example, a Power Analyzer PW6001 and current sensor are used to make the measurement, in which the instrument directly measures the voltage UL and the current IL that are applied to the reactor and then calculates the loss. Power as measured in this setup consists of the total of the power consumed in the winding and in the core. In short, the reactor’s overall loss is being measured.
Accuracy in this measurement can be increased by keeping the current wiring route and the connection of the voltage cables to the power analyzer as short as possible. In addition, it is necessary to consider the effects of metallic and magnetic objects in the vicinity of the reactor. Caution is necessary as wires and other nearby metallic objects may affect the operation of the reactor. Moreover, due to the potential for measurement to be affected by peripheral noise from the voltage cables, it is desirable to twist the cables before measuring.

Figure 2: Measurement of reactor loss in a boost chopper circuit
When measuring the loss of the core alone (core loss), the reactor voltage is measured after wrapping secondary wiring around the core as shown in Figure 3.

Figure 3: Measurement of core loss
Because core loss is defined as the area of the B-H loop, the core loss Pc per unit of volume can be calculated as follows, where T represents the duration of one B-H loop period:
If the core has a flux path length of l and a cross-sectional area of A, the relationships between the primary winding current i and magnetic field H and that between the secondary winding voltage v and magnetic flux density B are as follows:
Consequently, the core loss per unit of volume can be calculated as follows, where P represents the power calculated from the primary winding current i and the secondary winding voltage v.
In addition, since the core’s Volume is given by lA, the core’s overall core loss PcALL can be calculated as follows:
Accordingly, by making a measurement with the setup shown in Figure 3, it is possible to measure the core loss under actual operating conditions.
In addition, the Power Analyzer PW6001 can save 16-bit voltage and current waveform data sampled 5 MSa/s as CSV files and transfer data to MATLAB*, allowing the instrument to generate higher-precision waveform data than is possible to obtain with a standard waveform recorder. This data also can be used for analytical purposes, for example, to render the B-H loop.
*MATLAB is a registered trademark of Mathworks Inc.
Why is it difficult to measure reactor loss?
Inductance is the principal component in determining a reactor’s impedance. From a power measurement standpoint, the measurement is characterized by a low power factor. In short, the phase difference between the voltage and current is close to 90°. As illustrated in Figure 4, the effect of the phase error between the instrument’s voltage and current measurement units on measured values is greater than when measurement is carried out with a high power factor. Consequently, the measurement units must exhibit a high degree of phase precision.
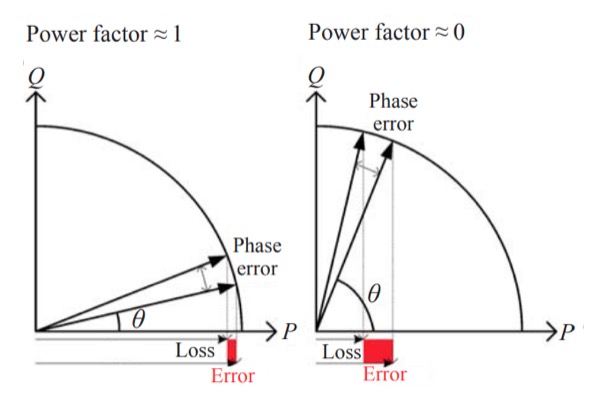
Figure 4: Relationship between phase error and power measurement error
In addition, reactors are switched at frequencies ranging from tens of kilohertz to hundreds of kilohertz. As described above, commercialization of SiC and GaN elements has resulted in a tendency toward rising switching frequencies, and it is necessary to use measuring instruments with high phase precision at such high frequencies. Furthermore, when using current sensors, it is necessary to consider the current sensor’s phase error.
Moreover, a large common-mode voltage will be applied to the voltage and current measurement units during the type of measurement illustrated in Figure 2. As a result, it is necessary to use an instrument with a high common-mode rejection ratio (CMRR).
As described above, the components under measurement are being switched at frequencies ranging from several tens of kilohertz to several hundreds of kilohertz, resulting in a measurement environment that is characterized by an extremely large amount of noise. Consequently, it is necessary to use an instrument that exhibits high noise resistance.
In this way, the conventional wisdom holds that measuring reactor loss is a difficult process because it requires an instrument that exhibits a high level of performance in numerous areas. These requirements can be met by using the Power Analyzer PW6001, which offers the following features:
- Broad band and high-precision phase characteristics thanks to its current sensor phase shift function [1]
- High CMRR (80 dB or greater at 100 kHz)
- High noise resistance thanks to a dedicated current sensor [2][3]
Instrument characteristics required for reactor loss measurement
Figure 5 illustrates the voltage and current waveforms that are applied to a reactor in a circuit such as that shown in Figure 2. The voltage waveform takes the form of a rectangular wave, while the current waveform takes the form of a triangular wave with a superposed DC component. To measure loss at a precision of 0.1% with waveforms such as these requires a band of about 5 to 7 times the switching frequency[4]. For example, with a switching frequency of 100 kHz, the measurement would need to provide a band of 500 kHz to 700 kHz.
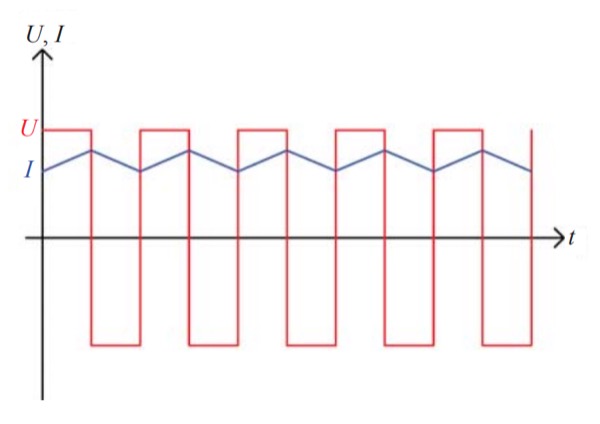
Figure 5: Reactor voltage and current waveforms in a boost chopper circuit
It is important to note that high-precision measurement capability is required not only for amplitude (gain), but also for the phase difference between voltage and current. To measure a high-frequency current in excess of several amperes, it is necessary to use a current sensor[2]. Since the current sensor’s phase error cannot be ignored at high frequencies, it is necessary to adopt some sort of correction method. Most other manufacturers’ power analyzers and oscilloscopes perform this correction using a deskew function. Depending on the current sensor’s characteristics, that approach requires using a different delay time for each measurement frequency. Consequently, it results in larger errors when measuring distorted waveforms such as triangular waveforms that have frequency components in a broadband. By using the Power Analyzer PW6001 with a high-precision current sensor along with the instrument’s phase shift function and entering the current sensors’ phase error at just one point into the PW6001, it is possible to make measurements with low phase error across a broad frequency band.
Example of Reactor Measurement with a Power Analyzer
This section describes an example of reactor measurement using the Power Analyzer PW6001 and the Current Box PW9100. Figure 6 provides a circuit diagram for the measurement, while Table 1 lists the specifications of the reactor under measurement. Measurement was performed while applying a sine signal with a power amplifier (4055, NF Corporation).
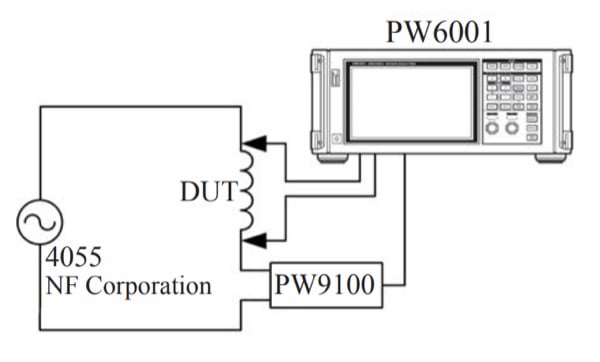
Figure 6: Measurement block diagram
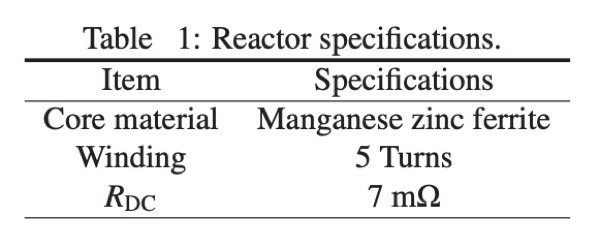
Table 1 Reactor specifications
Power analyzers are used to measure parameters such as RMS voltage and current values as well as phase error and power. The PW6001 allows operators to combine these basic measured values in the form of user-defined calculations that can be carried out in real-time. Reactor parameters can be measured by setting up the user-defined calculations listed in Table 2.

Table 2 Configuring user-defined calculations
Figure 7 illustrates the change in the inductance LS and the resistance RS when the current level applied to the reactor is varied at a frequency of 10 kHz, while Figure 8 illustrates the change in the inductance LS and the resistance RS when the AC current RMS value is fixed at 0.5 A and the DC bias current is varied at a frequency of 100 kHz. Ordinarily, LCR meters can only measure current on the order of several dozens of milliamperes. In addition, the range of DC bias currents that can be generated by LCR meters’ DC bias units is limited. As a result of these limitations, measured parameters differ from the values that characterize actual operating conditions. As this example demonstrates, a power analyzer and power source can be combined to measure a reactor at current levels that approach actual operating conditions.
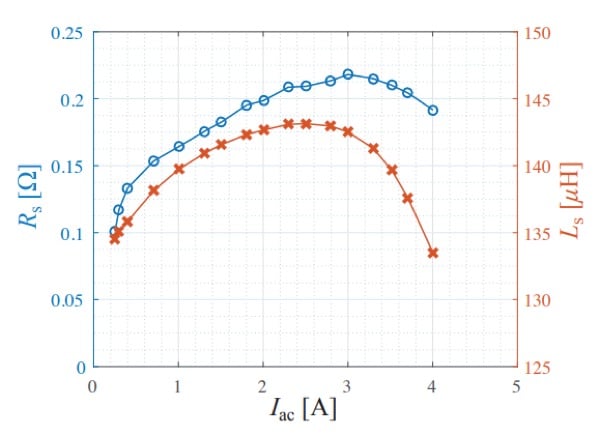
Figure 7: Measurement example illustrating the level dependence of inductance and resistance (f = 10 kHz)
This example illustrates the use of a power supply to apply sine-wave current and voltage. As described above, rectangular-wave voltage and triangular-wave current are usually applied to operating reactors, rather than sine-wave signals. A power analyzer allows direct measurement of reactors under such conditions. In addition, parameters such as LS and RS can be calculated based on the results of harmonic calculations performed by the instrument. These instrument characteristics make possible more accurate analysis.
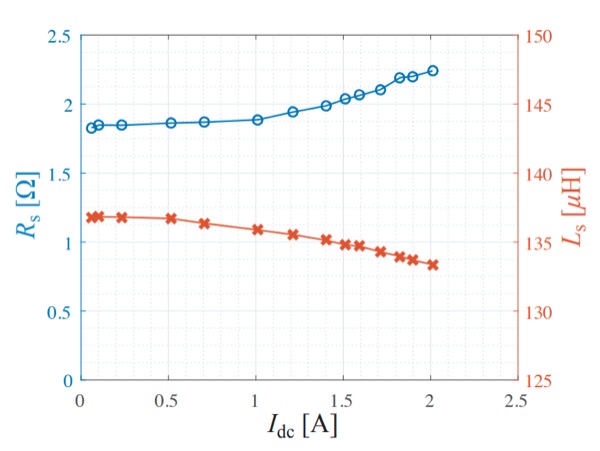
Figure 8: Measurement example illustrating the DC superposition characteristics of inductance and resistance (f = 100 kHz)
Conclusion
This article introduced a method for measuring and analyzing high-frequency reactor loss, with reference to an actual measurement example. In order to accurately measure loss and other parameters of high-frequency reactors, it is necessary to make measurements under conditions that approach actual operating conditions. In addition, this article described the high level of performance that is required for a power analyzer used to make such measurements. Finally, it offered an example in which a PW6001 Power Analyzer was used to measure and analyze reactor loss.
About the Author
Kazunobu Hayashi works as a Lead Engineer at Hioki E.E Corporation, a Japanese Electrical Measuring Equipment developer and manufacturer based in Ueda, City, Nagano Prefecture, Japan.
References
- Yoda, H., “Power Analyzer PW6001”, HIOKI Technical Notes, vol.2, no.1, 2016, pp.43-49.
- Yoda, H., H. Kobayashi, and S. Takiguchi, “Current Measurement Methods that Deliver High Precision Power Analysis in the Field of Power Electronics” Bodo’s Power Systems, April 2016, pp.38-42.
- Ikeda, K., and H. Masuda, “High-Precision, Wideband, Highly Stable Current Sensing Technology” Bodo’s Power Systems, July 2016, pp.22-28.
- Hayashi, K, “High-Precision PowerMeasurement of SiC Inverters” Bodo’s Power Systems, September 2016, pp.42-47.
This article originally appeared in the Bodo’s Power Systems magazine.