Facebook
 Google
 GitHub
 Linkedin
Digital Electronics Basics: Exclusive Gate, Logic Diagrams, and De Morgan Theorem
Learn about the combinational logic gates XOR and XNOR and the usefulness of logic diagrams and De Morgan’s theorem.
The Exclusive OR (XOR) gate assumes the logic 1 state if one and only one input assumes the logic 1 state, and the Exclusive NOR (XNOR) gate does the opposite. Logic diagrams graphically illustrate logical relationships. De Morgan’s theorem is a useful tool in digital design.
This article’s analyses assume positive logic.
The Exclusive OR Circuit (XOR)
We must distinguish between the Exclusive OR (XOR) operator from the (Inclusive) OR operator. An XOR obeys the definition: the output of a two-input XOR assumes the logic 1 state if one and only one input assumes the logic 1 state.
This gate can be used to compare the input logic levels to check if they are equal.
Figure 1 shows the symbol and Boolean expression for a two-input XOR gate, where the sign ⊕ indicates the XOR function.
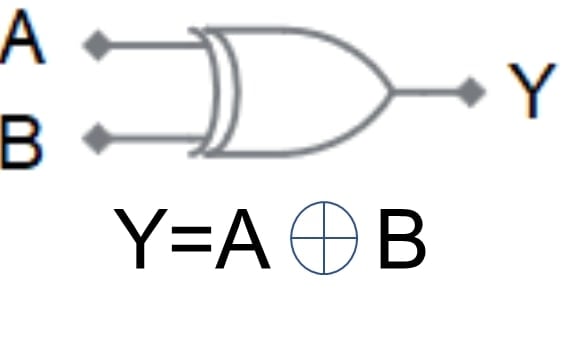
Figure 1. The symbol for a two-input XOR gate and its Boolean expression.
Table 1 shows the truth table for an XOR circuit.
| A | B | Y |
| 0 | 0 | 0 |
| 0 | 1 | 1 |
| 1 | 0 | 1 |
| 1 | 1 | 0 |
Table 1. The truth table for an Exclusive OR circuit.
You can verify that the XOR of A and B can be produced by the following statement
\[Y=(A+B)(\overline{AB})\]
Figure 2 shows a logic block diagram to realize this function. It requires one OR gate, one NAND gate, and one AND gate.
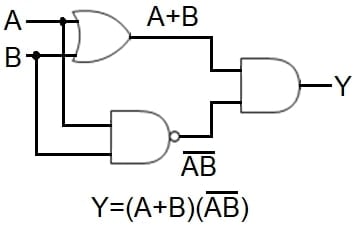
Figure 2. A logic block diagram for the XOR Gate.
Figure 3 illustrates an electromechanical implementation of the block diagram above – a battery-powered LED circuit employing the OR, NAND, and AND gates.
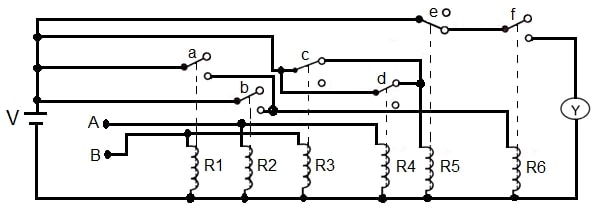
Figure 3. An electromechanical XOR circuit.
Initially, terminals A and B are de-energized (logic 0). Solenoid R5 keeps switch e closed, but the LED remains off (logic 0) with the contact f open.
Applying the battery voltage to the B terminal only (logic 1) energizes solenoids R1 and R3, closing switch a and opening switch c. The closing of switch a energizes solenoid R6, closing switch f and turning the LED on (logic 1).
Applying the battery voltage to the A terminal only (logic 1) energizes solenoids R2 and R4, closing switch b and opening switch d. The closing of switch b energizes solenoid R6, which closes switch f. Again, the LED is on (logic 1).
Applying the battery voltage to terminals A and B simultaneously (logic 1) energizes solenoids R1, R2, R3, and R4, closing switches a and b and opening switches c and d. The opening of switches c and d de-energize solenoid R5, opening switch e. Under this condition, the LED is off (logic 0).
Table 2 summarizes the status of the switches under different logic states.
| INPUT | SWITCH | OUTPUT (Y) | LED | ||||||
| A | B | a | b | c | d | e | f | ||
| 0 | 0 | Open | Open | Closed | Closed | Closed | Open | 0 | OFF |
| 0 | 1 | Closed | Open | Open | Closed | Closed | Closed | 1 | ON |
| 1 | 0 | Open | Closed | Closed | Open | Closed | Closed | 1 | ON |
| 1 | 1 | Closed | Closed | Open | Open | Open | Closed | 0 | OFF |
Table 2. Summary of status of switches in figure 3.
Note that only the logic states 01 and 10 close switches e and f, applying the battery voltage to the LED and turning it on.
Among the applications of the XOR gate, we have arithmetic logic circuits in computers, inequality comparators, matching circuits, and error detectors.
The Exclusive NOR Circuit (XNOR)
Complementing the output of an XOR gate, we get the XNOR gate. An XNOR obeys the definition: the output of a two-input XNOR assumes the logic 0 state if one and only one input assumes the logic 1 state.
Figure 4 shows the symbol and Boolean expression for a two-input XNOR gate.
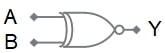
\[Y=\overline{A\oplus B}\]
Figure 4. The symbol for a two-input XNOR gate and its Boolean expression.
Table 3 shows the truth table for an XNOR circuit.
| A | B | Y |
| 0 | 0 | 1 |
| 0 | 1 | 0 |
| 1 | 0 | 0 |
| 1 | 1 |
1 |
Table 3. The truth table for an XNOR circuit.
Two-level Logic
Many digital designs require several gates (OR, AND, or combinations) feeding an OR (or AND) gate. Two-level logic is the name given to this kind of combination. The XOR circuit shown in figure 2 is an example of two-level logic.
Logic Diagrams
We can use diagrams to illustrate logical relationships graphically. These diagrams are made up of blank boxes and shaded boxes representing logic 1 and logic 0 conditions. Other names for these diagrams are logic graphs and logic charts.
The use of these diagrams is not new. Charles L. Dodgson (1832-1898), an English mathematician and writer, described some logical associations in his books “The game of logic” and “Symbolic logic” (Dodgson authored Alice’s Adventures in Wonderland (1865) under the pseudonym Lewis Carroll).
Another contributor to logical representations with diagrams was Edward W. Veitch, who published the paper “A chart method for simplifying truth functions” (Proceedings, Association of Computing Machinery, 1952).
Logic diagrams also receive the name of Karnaugh maps (K-Maps) in memory of Maurice Karnaugh, who refined Veitch’s method and published the paper “The map method for synthesis of combinational logic circuits” (Transactions, AIEE, C&E, vol 72, November 1953). Karnaugh’s words: “Employment of the map method seems to be profitable when nontrivial problems in combinational circuit synthesis arise. Its most important advantages appear to be flexibility and speed. Further, if such problems arise frequently, it is advantageous to have a method, such as this, which can be learned and used effectively in a short time by designers new to the field.”
Figure 5 shows some basic logical two-dimensional diagrams. Rows represent logic 1 and logic 0 inputs for variable A, and columns represent logic 1 and logic 0 inputs for variable B. A shaded logic 0 zone is the negation of a shaded logic 1 zone, and vice versa.
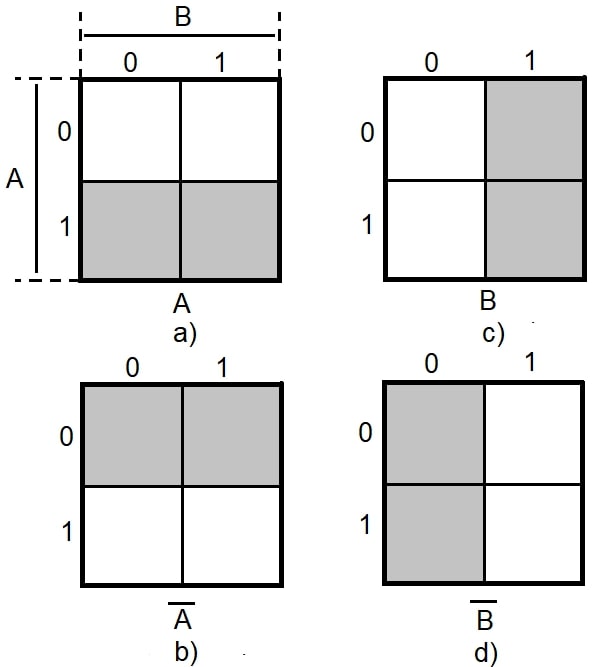
Figure 5. Some basic logical diagrams.
Figure 5a shows variable A by shading the row with input logic 1. The row with input logic 0 is blank. Figure 5b shows the negation \(\overline{A}\) of figure 5a, shading the row with input logic 0 and leaving blank the row with input logic 1. Note that the shaded area in figure 5b is the mirror image of figure 5a.
Following the same procedure, figure 5c defines the variable B by shading the column with input logic 1. The column with input logic 0 is blank. Figure 5d shows the negation \(\overline{B}\), shading the column with input logic 0 and leaving blank the column with input logic 1. Again, note that the shaded area in figure 5d is the mirror image of figure 5c.
Logic Diagrams for Basic Gates
The following figures show some basic logic gates together with their two-dimensional logic diagrams.
The rules are as follows:
1. The intersection of a row and a column represents the logic state corresponding to the selected logic inputs.
2. The square that forms the intersection is true (logic 1) when shaded and false (logic 0) when blank.
Logic Diagram and Truth Table for the AND Gate
Figure 6 and table 4 show the logic diagram and truth table for the AND gate.
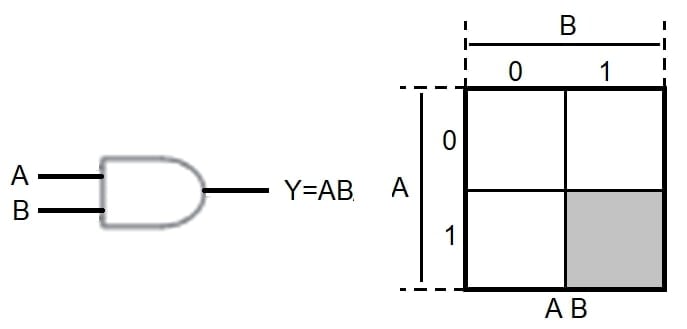
Figure 6. Logic diagram for the AND gate.
| A | B | Y |
| 0 | 0 | 0 |
| 0 | 1 | 0 |
| 1 | 0 | 0 |
| 1 | 1 | 1 |
Table 4. The truth table for the AND gate.
Selecting row 1 for input A and column 1 for input B, their intersection is the square at the bottom right of the diagram. Since this square is shaded, it is true (logic 1) and represents the function Y = 1 ∙ 1 = 1. The remaining squares are blank; therefore, they are false (logic 0). These results match the truth table for the AND gate.
Figure 7 shows the AND gate with both inputs negated.
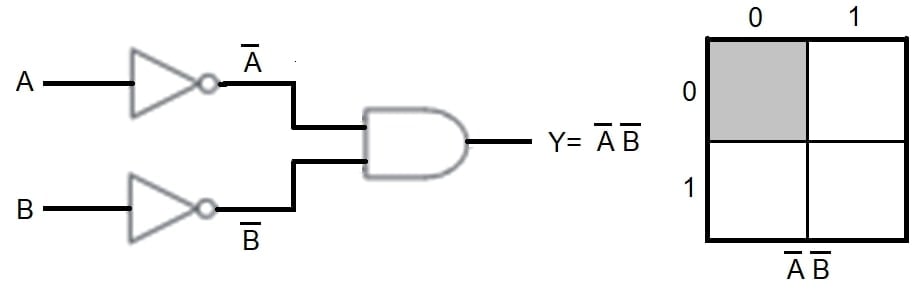
Figure 7. Logic map for the AND gate with inputs negated.
The negation gates placed at the AND gate inputs invert the variables A and B before entering the gate; then, the input values to the AND gate are \(\overline{A}\) and \(\overline{B}\), resulting in the output \(\overline{A}\:\overline{B}\).
The logic diagram to the right of the symbolic representation illustrates this logic function. With both inputs negated, the shaded square showing their intersection is diagonally opposite to the previous case, with the truth table as shown in table 5.
| A | B | Y |
| 0 | 0 | 1 |
| 0 | 1 | 0 |
| 1 | 0 | 0 |
| 1 | 1 | 0 |
Table 5. The truth table for the AND gate with inputs negated.
Logic Diagram and Truth Table for the OR Gate
Figure 8 and table 6 show the logic diagram and truth table for the OR gate.
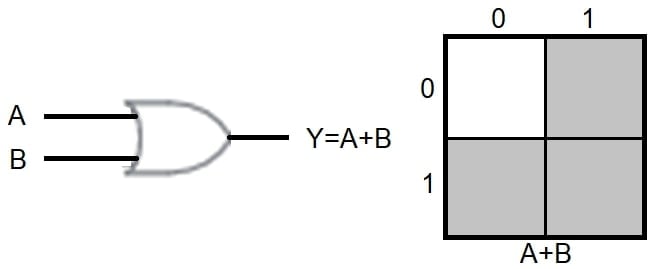
Figure 8. Logic diagram for the OR gate.
| A | B | Y |
| 0 | 0 | 0 |
| 0 | 1 | 1 |
| 1 | 0 | 1 |
| 1 | 1 | 1 |
Table 6. The truth table for the OR gate.
Again, the shaded squares are true (logic 1) and the blank square is false (logic 0), matching the truth table for the OR gate.
Figure 9 shows the OR gate with both inputs negated. Each input has a NOT gate, so the OR gate is applied to the complemented variables, obtaining the output.
The logic diagram represents this function. The truth table for this example is shown in table 7.
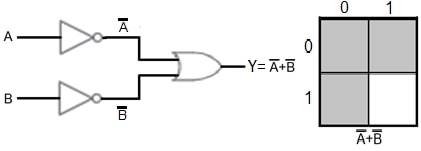
Figure 9. Logic diagram for the OR gate with inputs negated.
| A | B | Y |
| 0 | 0 | 1 |
| 0 | 1 | 1 |
| 1 | 0 | 1 |
| 1 | 1 | 0 |
Table 7. The truth table for the OR gate with inputs negated.
An Additional Example
Figure 10 shows another example of logic diagrams.
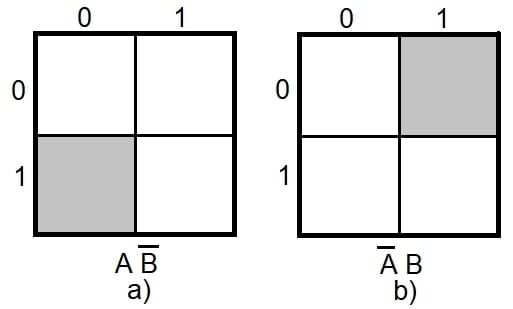
Figure 10. Examples of logic diagrams.
Figure 10a illustrates the function \(A\overline{B}\). The two squares on the bottom row represent the state of logic 1 of variable A, and the two squares on the left column represent the negation of variable B (logic 0). The intersection of the row and column is the shaded square. The other squares remain blank.
Figure 10b illustrates the function \(\overline{A}B\). Likewise, the two squares on the top row represent the negation of variable A (logic 0), and the two squares in the right column represent the state of logic 1 of variable B. The intersection of the row and column is the shaded square. The other squares remain blank.
Multiple-input Logic Diagrams
Multiple-input logic diagrams are more helpful in simplifying logic circuits. Figure 11 shows a three-input logic diagram by way of example.
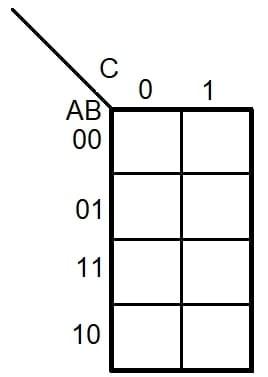
Figure 11. A three-input logic diagram.
The De Morgan Theorem
The 19th-century British mathematician Augustus De Morgan developed a vital theorem that has proven to be very useful in Boolean algebra – and engineering for creating logic gates – by simplifying the negation of a complex Boolean expression.
The concept of this theorem can be more easily grasped by first studying what fundamental difference exists, in logics, when a negation precedes a logical expression and when that negation follows the term.
Figure 12 shows the effect of the NOT function after the AND gate.
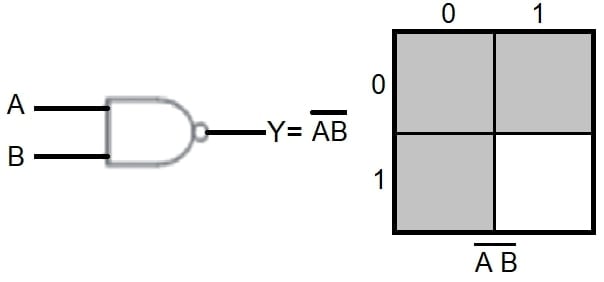
Figure 12. Effect of the NOT function after the AND gate.
The negation at the output of the AND gate inverts the value AB, resulting in the output \(\overline{AB}\) and the corresponding logic diagram.
Comparing the logic diagrams in figures 12 and 9, we observe that the expression \(\overline{AB}\) is equivalent to \(\overline{A}+\overline{B}\).
Figure 13 shows the effect of the NOT function after the OR gate.
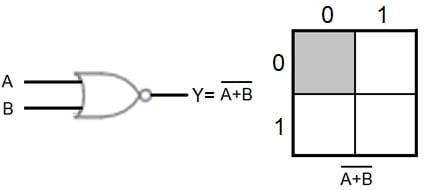
Figure 13. Effect of the NOT function after the OR gate.
When the gate NOT negates the output, it complements A+B resulting in the output \(\overline{A+B}\). The logic diagram of this function is identical to that of the expression \(\overline{A}\:\overline{B}\) in figure 7.
In short, the logic diagram of \(\overline{AB}\) in figure 12 is precisely the same as that of expression \(\overline{A}+\overline{B}\) in figure 9, and the logic diagram for \(\overline{A+B}\) in figure 13 is identical to that of term \(\overline{A}\:\overline{B}\) in figure 7.
These results illustrate De Morgan’s theorem, or equivalence law: “The complement of a product of literals is equivalent to the sum of the complements of the literals, and the complement of a sum of literals is equivalent to the product of the complements of the literals.”
\(\overline{AB}\) is equivalent to \(\overline{A}+\overline{B}\)
and its dual,
\(\overline{A+B}\) is equivalent to \(\overline{A}\:\overline{B}\)
About Exclusive Gate, Logic Diagrams, and De Morgan theorem
The Exclusive OR (XOR) gate gives logic 1 output if either, but not both, of its two inputs, are logic 1. The expression \(Y=A\oplus B\) means XOR operation.
The Exclusive NOR (XNOR) gate gives a logic 0 output if either, but not both, of its two inputs, are logic 1. The expression \(Y=\overline{A\oplus B}\) means XNOR operation.
A Karnaugh map (K-map) allows viewing the function in a diagram form.
De Morgan’s theorem affirms that the complement of the product of variables is equal to the sum of the complement of each variable. Similarly, the complement of the sum of variables is equal to the product of the complement of each variable.
Featured Image used courtesy of Shutterstock