Facebook
 Google
 GitHub
 Linkedin
Measuring Energy Use, Time and Cost to Quantify Transportation System Efficiency
Many people looking for a new house have considered metrics like "walk score," or "transit score," and even "bike score." But what most don't know is that these metrics, while useful, aren't designed to capture the whole story of an area's transportation options. By capturing their essence and building in significant new capabilities, this farther-reaching metric assesses the full landscape of transportation choices and related impacts.
In the image above, Venu Garikapati, Kay Kelly, Stan Young, and Yi Hou work on the Mobility Energy Productivity metric that quantifies the efficiency of transportation systems while taking time, affordability, and energy use into consideration. (Photo by Dennis Schroeder / NREL)
Existing metrics tell users how quickly they can get from here to there using a single mode of travel, like walking, biking, or taking a bus. It's tougher for a user who takes a light rail to work but drives elsewhere to see what's in store for them. It's even harder for someone who wants to know which combination of travel modes will get them to their destination on time and within budget, while also being the most energy efficient option.
You may also like: How BART Kept its Electric Trains Running During PG&E’s First Power Shutoff
That's why a U.S. Department of Energy (DOE) collaboration, led by the National Renewable Energy Laboratory (NREL), developed the Mobility Energy Productivity (MEP) metric.
 A colorized nighttime cityscape overlaid with interconnected circular graphics that represent different transportation options. The MEP metric can help guide planners in navigating increasingly complex transportation-related decisions. Image courtesy of iStock.
Computation Based on Time, Energy, Affordability, and More
The MEP metric measures the existing and potential impact of all mobility options in a given area. It focuses on travel time, energy, and affordability… existing metrics only consider one, or at the most two of these. And it does so in a way that assesses both existing and future mobility options.
"If you can't measure something, you don't have a way to gauge the impact of changes in the system," said Johney Green, associate lab director for Mechanical and Thermal Engineering Sciences at NREL. "Thanks to the MEP metric, we finally have a holistic measure of mobility, and can quantify how certain choices positively or negatively affect everything from traffic flow to air quality, and more."
Existing transportation metrics such as vehicle miles traveled, roadway capacity, or traffic congestion address only a single mode of transportation, and measure only that mode's functional efficiency—not the overall ability to efficiently link people to goods, services and employment, a critical factor to urban quality of life.
The location-based MEP metric, meanwhile, measures the potential to connect individuals to services and activities using various modes of transportation. It does so relative to the convenience, cost including transit fares and fuel prices, and energy consumption in providing these connections.
"The MEP metric builds on existing accessibility calculation methods, combining mode availability, sustainability, and affordability evaluations with geospatial analyses," says NREL and MEP Researcher Yi Hou.
The MEP weighs locations visited often, like an office building where people go every day, more than less-visited venues like movie theaters. It contrasts the effectiveness of ridesharing services against other options, like public transportation.
Locations with a high MEP score have more efficient, affordable options providing access to a greater number of destinations.
"The MEP metric applies a mathematical framework to a range of variables, rolling them up into a single, simple score," said NREL Transportation Data Analytics Researcher and MEP Project Leader Venu Garikapati. "The result is a robust assessment of the ease of access provided to any traveler at any location, which can be scaled up from a specific neighborhood to an entire state or region."
Multiple Scenarios, Factors, Scales, and Time Frames
Visual mapping of MEP scores in Columbus, Chicago, and San Francisco areas:
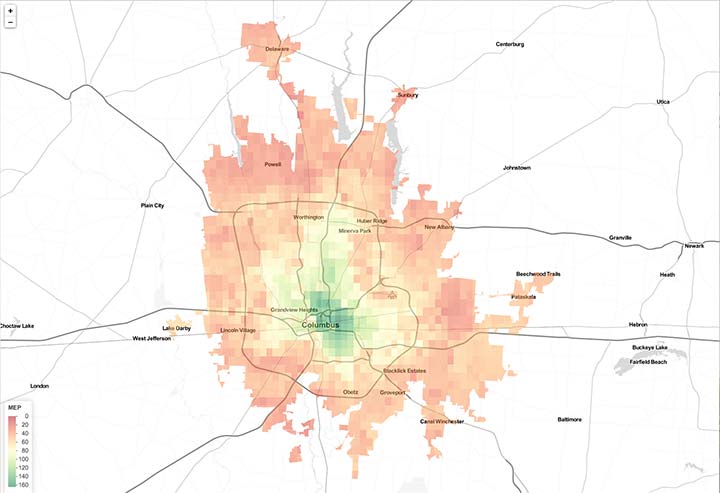 A map of the Columbus, Ohio metro area showing color-coded Mobility Energy Productivity scores, with scores increasing closer to the urban center.
 A map of the Chicago, Illinois metro area showing color-coded Mobility Energy Productivity scores, with scores increasing closer to the urban center.
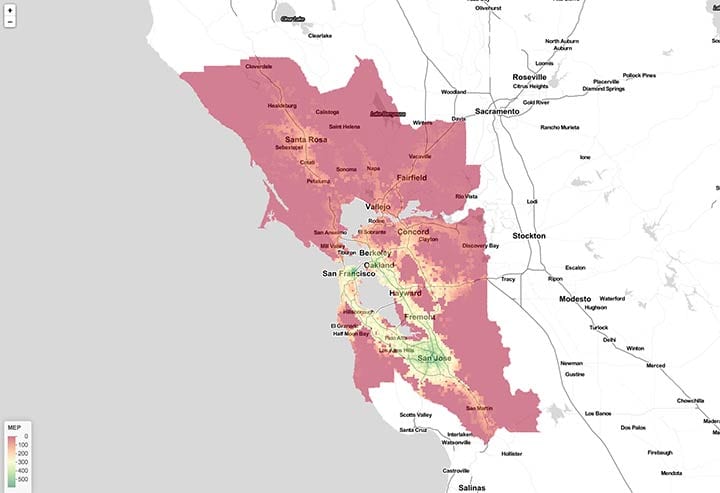 A map of the San Francisco, California metro area showing color-coded Mobility Energy Productivity scores, with scores increasing closer to the urban center.
Baseline MEP scores vary from city to city and state to state based on population and development, as would be expected—bigger cities provide more opportunities. However, within a city, the MEP score depends on the geography, building density, travel patterns and, most importantly, the efficiency of the holistic transportation system to connect people to their destinations—providing an intuitive referencing tool to judge relative impacts of future mobility technologies as transportation systems evolve.
"In order to capture the impacts of a dynamic transportation landscape, we need a metric that accurately assesses the benefits offered by different modes while accounting for the costs—time, energy, and money—associated with them," said NREL Project Leader Kay Kelly.
The MEP team has calculated initial baseline metrics for cities in all 50 states. Take Columbus, Ohio. Areas closer to the city center boast MEP scores in the 220-240 range, thanks to energy-efficient transportation options and rich land use in the urban core. But in the suburbs and exurban locations, the score falls to 40-60, due to reliance on personally owned vehicles in those areas, and sparse destinations. As new mobility technologies, business models, land use changes, and transportation infrastructure evolve, the MEP can be used to assess both overall, as well as location-specific (downtown, suburbs, and outlying communities) impacts.
These scores consider both current circumstances and future developments. This includes:
- Widespread deployment of connected, automatic, and electric vehicles
- Growth of on-demand ridesharing services
- Highway expansion
- Investments in Public Transit
- New shopping centers.
The complexities of measuring these factors call for collaboration of some of the nation's foremost mobility experts. DOE's Office of Energy Efficiency and Renewable Energy's Vehicle Technologies Office formed the Energy Efficient Mobility (EEMS) Program and the Systems and Modeling for Accelerated Research in Transportation (SMART) Mobility Lab Consortium to tackle this challenge - in collaboration with leading university experts, the U.S. Department of Transportation (DOT), and several state and local DOTs.
The Laboratory Consortium consists of:
- Argonne National Laboratory
- Idaho National Laboratory
- Lawrence Berkeley National Laboratory
- National Renewable Energy Laboratory
- Oak Ridge National Laboratory.
The SMART Mobility Lab Consortium has built a framework of transportation models, allowing researchers to identify the potential deeper impacts of new mobility strategies. This integrated framework brings MEP computation together with other National Lab modeling capabilities to evaluate the impact of new technology, infrastructure improvements, mobility business models, and land use changes.
Advanced agent-based transportation models (POLARIS and BEAM) developed at sister labs make it possible to simulate every traveler and each decision made within a region. These advanced models are used to assess the Chicago and San Francisco markets—and subsequently, the MEP is driven from these models to view the holistic mobility impact relatively to travel, affordability, and energy—and to visualize that impact, not only for the region, but the relative impacts on, for example, the central business district, as opposed to suburban locations. These results are then transferable to other cities and regions.
Future MEP analysis will use data sets generated by transportation models (that are available for any U.S. metropolitan area) that reflect both the first- and second-order impacts of mobility changes. For example, do ride hailing services increase convenience or congestion—or both? Are the impacts a net positive or negative for the community?
A Metric with Momentum
The MEP metric is already generating buzz. The American Society of Civil Engineers (ASCE) has selected MEP for a foundational standard in their emerging Smart Cities (referred to as ES-X) standards portfolio under development. The basics of the theoretical underpinning and mathematical formulation was the focus of a paper published in the Transportation Research Record. And DOE's Office of Energy Efficiency and Renewable Energy's Vehicle Technologies Office recognized the NREL team behind the metric with an award at its Annual Merit Review meeting. When presented to cities or Metropolitan Planning Organization (MPOs), the MEP never ceases to strike the nerve of practitioners as a greatly needed metric to fill a gap in tying together development with transportation.
What's Next?
NREL is also working on personalized measures so individuals can assess the mobility potential at their location based on their preferences for modes and activities.
Although much theoretical work has been accomplished, additional research is ongoing to properly reflect multi-modal trips, as well as characterize emerging modes appropriately.
The current MEP framework is primarily urban focused. Work is under way to extend the MEP appropriately for rural regions, acknowledging that priorities and preferences changes across the geographic spectrum.
Lastly, recognizing that metrics are most useful when they can be visualized and used in an easy-to-use format, NREL is working with web and analytics partners to create intuitive, yet thorough web-based tools for any person to begin exploring their community from a MEP perspective.
Maximizing Mobility R&D Efforts
Today's travelers value convenience and efficiency. They also seek to minimize time, cost, energy consumption, and emissions associated with travel.
The MEP helps evaluate the overall impacts, benefits, and relative tradeoffs of this multifaceted universe of mobility options. "Regional planners, developers, and others can use the metric to objectively weigh plans for capital improvements," says NREL Mobility Systems Team Leader Stan Young. "Whether they're looking at road systems, airport infrastructure, or overall community master plans, the MEP scores can help prioritize mobility decisions. When we invest billions of dollars in infrastructure that will last decades, we want to get it right."
The MEP metric represents just a fraction of the NREL's overall efforts to develop efficient, intelligent, integrated, and dynamic mobility systems. The lab's Sustainable Mobility Initiative bridges multiple research teams to approach transportation as a network of travelers, services, and environments—rather than just vehicles and roads—using connectivity and automation to optimize mobility and significantly reduce related energy consumption.