Facebook
 Google
 GitHub
 Linkedin
Designing Onboard Chargers for High Performance and Power Density
How fast an EV charges is at the heart of EV adoption. Here's how the onboard charger plays a pivotal role.
Electric vehicles (EVs) are becoming more ubiquitous every day, and plenty of countrywide and global incentives are making these vehicles more cost-effective for consumers. This has resulted in more than 13 million electrified vehicle sales in 2023, a greater than 30% increase for battery electric vehicles (BEV) and plug-in hybrid electric vehicles (PHEV) compared to the units sold in 2022.
Vehicle manufacturers continue ramping up their efforts toward EVs as carbon neutrality becomes a global theme. While a 300-mile range was a benchmark for EVs, newer EVs feature up to a 400- to 500-mile range. On the other hand, most plug-in hybrids offer a power train that can drive 25 to 50 miles on battery alone and then supplement the battery with an internal combustion engine.

Figure 1. Onboard charger. Image used courtesy of Adobe Stock
The Importance of Onboard Chargers
One important aspect of owning an EV is how fast the car can charge—one system that affects EV charging at home is the onboard charger (OBC). The OBC converts the AC grid voltage found in the user’s home to a DC voltage that can charge the EV or PHEV battery. These are typically charged using an L1 or L2 AC charger, which can be found in homes and workplaces. L1 chargers can provide anywhere from 1 kW to 3 kW of power, while L2 chargers can provide anywhere from 3 kW to 22 kW of power.
Traditionally, onboard chargers have supported 3.3 kW (or even 6.6 kW) for many plug-in hybrids. However, battery sizes are increasing to combat range anxiety, so many EVs today have 11 kW OBCs. New, ongoing designs can increase to 22 kW, enabling even faster charging speeds.
Table 1 shows different power ratings for an OBC system and how quickly an EV can charge a battery from 10% to 90%. The range is calculated assuming an efficiency of 3 miles/kWh. Most EV manufacturers recommend that users keep their battery charged below 80% to 90% for day-to-day driving to reduce battery degradation and only charge to 100% for longer road trips.

Based on Table 1, there are significant advantages to having a high-power onboard charger in a vehicle. One caveat is that the power rating of the OBC is the maximum amount of power the battery can charge from an AC source, but the actual output power depends on the AC charger used, as well as the voltage and maximum current that the wall charger itself can supply. For example, if a charger is connected to a 208 V voltage supply and has a circuit breaker rated for 50 A, then that charger can deliver 10.4 kW (208 V x 50 A) of power. This means an 11 kW OBC would be required to take full advantage of the available charging speed.
Architecture of an Onboard Charger
An onboard charger comprises several stages to convert the AC power to DC power.
First is the one- to three-phase power factor correction (PFC), which converts the AC voltage from the grid into an intermediate DC voltage between 400 V and 800 V, depending on the vehicle battery’s voltage (note that battery voltages have been increasing to allow for higher efficiency, faster charging times, and lighter cabling within a vehicle). Though the PFC architecture can range from one to three phases, three phases have become more popular as power levels increase.
The second stage is the isolated DC/DC stage, which converts the intermediate DC voltage to the target voltage. The target voltage is specific to the battery being charged and can vary between 200 V and 800 V, depending on whether a PHEV or BEV is charged. It is common for the DC/DC stage to use LLC and phase-shift, full-bridge converter topologies.
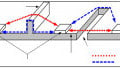
Figure 2 shows the OBC block diagram.

Figure 2. OBC system with a PFC stage and isolated DC/DC stage. Image used courtesy of MPS
Some of the challenges of these systems include increasing power density to minimize the size of the OBC and meet rising power levels of up to 22 kW. As battery voltages have increased from 400 V to 800 V, the industry has seen a wider adoption of silicon carbide (SiC) instead of the traditional IGBTs to improve efficiency and power density.
As the battery voltage rises, it is vital to isolate these systems to ensure safety with high bus voltages and high power levels. MPS offers several isolation solutions that can be used in OBCs and provide up to 5 kVRMS isolation.
The MPQ188xx family features dual-channel, automotive-grade isolated gate drivers with several package options to achieve up to a 5 kVRMS isolation. The MPQ18831 is a dual-input half-bridge driver with adjustable dead time control. The MPQ18851 is a dual-channel gate driver that allows for two independent inputs. The products have both a wide-body (WB) SOIC-16 package and an SOIC-14 WB package that offers 3.3 mm creepage between the output drivers. The SOIC-14 WB package is recommended for 400 V/800 V systems because it increases the creepage between the high-side and low-side outputs. These dual-channel isolated gate drivers offer up to 4 A source and 8 A of sink current to enable higher efficiency and allow the SiC or IGBT FETs to be turned on and off faster.
Advantages of Using an LLC Power Supply
The MPQ18913 is an automotive-grade LLC transformer driver for isolated biased supplies. This device can work with SiC MOSFETs as an isolated bias for SiC gate drivers. A flyback topology is often used for isolated power supplies to provide an isolated 18 V/-4 V output that drives the SiC FET. Figure 3 shows a typical application circuit implemented with the MPQ18913 to achieve an 18 V/-4 V output. Based on the transformer, the number of outputs can be configured, and the output voltage (VOUT) can be altered via the turns ratio.

Figure 3. MPQ18913 application circuit. Image used courtesy of MPS
Using the MPQ18913 as an LLC converter with a resonant LLC tank that acts as a magnetizing inductor for energy transfer, an additional capacitor and inductor make the tank resonate at a certain frequency to achieve soft switching and ensure highly efficient power conversion (see Figure 4). The transformer’s leakage inductance can be used as the tank’s resonant inductor, eliminating the voltage spike from the leakage inductance and improving efficiency compared to flyback topologies.
This soft-switching topology also helps when considering electromagnetic interference since there is no overshoot or ringing, which is common with a hard-switching topology such as a flyback.

Figure 4. LLC topology. Image used courtesy of MPS
LLC Isolated Bias Supply vs. Discrete Half Bridge Driver
In the MPQ18913, the LLC resonant topology offers several notable advantages compared to a half-bridge driver. A half-bridge driver requires a microcontroller and two external FETs, which can lead to larger solution size and complexity in the design.
The MPQ18913 integrates the half-bridge driver with a controller and FETs in a tiny 2 mm x 2.5 mm package (Figure 5). This reduces the total solution cost, the number of components that must be sourced, and the manufacturing complexity. The MPQ18913 also integrates several features, such as over-current protection (OCP), over-temperature protection (OTP), and soft start. Compared to a discrete half-bridge gate driver, the MPQ18913 is significantly smaller and less complex (see Figure 5).
_vs_._a_discrete_half-bridge_gate_driver_(right)_.jpg)
Figure 5. Comparison of an LLC gate driver bias supply (left) vs. a discrete half-bridge gate driver (right). Image used courtesy of MPS
LLC Isolated Bias Supply vs. Flyback
Another common topology for the gate driver bias supply is the primary-side regulation (PSR) flyback topology. One advantage of an LLC resonant topology is its reduced solution size. This is due to the switching frequency (fSW), which can reach up to 5 MHz; meanwhile, flyback topologies have an fSW below 400 kHz. This results in a total solution size that can offer a similar power level while 40% smaller.

Figure 6. Comparison of LLC topology vs. flyback total solution size. Image used courtesy of MPS
Table 2 demonstrates the benefits of the MPQ18913 compared to a standard flyback topology.

Takeaways of High-Frequency LLC Power Supplies
High-frequency LLC power supplies can be more difficult than low-frequency converters to implement and optimize. The MPQ18913 simplifies LLC power supply design with features such as automatic resonant frequency detection, integrated FETs, and an integrated controller. Further, LLC resonant topologies reduce solution size, increasing power density for high-power onboard charger designs.
As electric vehicles become more commonplace, automotive-grade power management solutions and LLC power supplies will be more frequently used to bias SiC FETs in various EV and power electronics applications, such as OBCs, traction inverters, and DC/DC converters. The MPS electrification page provides more information regarding onboard chargers, traction inverters, and DC fast-charging stations.