How Are Renewables Faring in the US Generation Mix So Far in 2023?
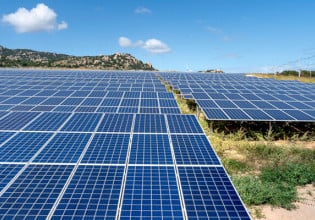
While electrical generation from renewables remained relatively flat in the first half of 2023, utility-scale solar thermal and photovoltaic (PV) facilities and small-scale PV systems tracked notable growth.
Renewables and conventional hydropower accounted for 23.7% of net electrical generation at utility-scale facilities in the first half of 2023 (January to June), according to new statistics collected by the U.S. Energy Information Administration (EIA). The share of renewables (17%) covers wind, solar thermal and photovoltaics (PV), wood and wood-derived fuels, other biomass, and geothermal sources.
Solar panels and a windmill. Image used courtesy of Pexels
However, counting small-scale distributed solar PV systems, such as rooftop solar panels, boosts the combined share of renewable and hydroelectric generation to 25%, about the same as last year. It’s worth including small-scale facilities because generation in this category increased by 25.6% compared to the first half (H1) of 2022, surpassing all other resources.
Zooming out, solar PV’s total share (small- and utility-scale) is still only a fraction of the full mix, hovering at around 5.8% compared to 5% last year. Meanwhile, production fell across all categories of fossil fuels except natural gas.
Let’s dive into some of the trends.
Utility-Scale Renewable Generation
The EIA’s latest Electric Power Monthly report shows that utility-scale renewable generation (excluding hydroelectric) fell by 2.7% in H1 2023, compared to the same period last year. Wood and wood-derived fuels registered the largest drop (-10.4%), followed by other biomass (-5.6%), wind (-5.2%), and geothermal (-2.7%). Solar thermal and PV represent the only category of non-hydro renewables that grew, at +7.3%.
The two largest renewable energy sources—wind and solar—accounted for 17% of total generation compared to 16.7% last year. This is consistent with the EIA’s predictions earlier this year that both would claim 16% of the mix in 2023, up from 14% in 2022.
Now, let’s consider hydropower and nuclear: Generation from conventional hydroelectric facilities claimed 6% of the mix, but production dropped 10.8% compared to H1 2022. Nuclear’s share was 19%, down 0.7% year-over-year.
Declining Fossil Fuel Output
Coal, petroleum liquids and coke, natural gas, and other gasses claimed 57% of the total generation mix from January to June 2023. Despite that dominance, most fossil fuel categories registered year-to-date declines, with coal falling by 27.3%, petroleum liquids down by 22.6%, petroleum coke by 49.3%, and other gas by 4.5%. Natural gas was the only category with a higher output than last year, charting an 8.3% increase.
The EIA previously projected that generation from coal would fall from a 20% share in 2022 to 18% in 2023, while natural gas would drop from 39% to 38%. So far this year, coal’s decline has outpaced those projections, with a 15% share compared to 19% H1 2022. Natural gas comprises 41% of the mix compared to 36.6% last year.
Capacity Growth
As mentioned, solar thermal and PV generation grew 7.3% in H1 2023 amid rapid growth in the industry. Another recent report from the EIA shows that 5.9 gigawatts (GW) of utility-scale generating capacity came online in H1 2023, 35% of the total 16.8 GW added across all sources.
Behind solar, natural gas claimed the second highest share with 34%, adding 5.7 GW of capacity in H1. Two large-scale natural gas-fired plants came online recently: Ohio’s 1.8 GW Guernsey Power Station and the 1.25 GW CPV Three Rivers Center in Illinois.
Cumulative utility-scale electric generating capacity additions in 2023. Image used courtesy of the EIA
Wind accounted for about one-fifth of capacity additions, followed by 11% of battery storage.
Developers plan to add 35.2 GW of additional capacity in the second half of 2023: More than half is solar (19.3 GW), followed by battery storage (7.8 GW) and wind (nearly 5 GW).
The EIA’s latest Electric Power Monthly report is available online.


