Facebook
 Google
 GitHub
 Linkedin
Swept Transient Frequency Response for the LLC Converter
In this article, we apply the same simulation approach to other articles in this series using the RidleyBox®/AP310 emulation models to a more complex and variable circuit – the LLC converter.
LLC Converter Test Circuit
The LLC converter has become increasingly popular over the last 20 years with the push to higher efficiencies and lower switching stress and noise. The converter works very well with a pseudo-regulated input line, and the widespread adoption of the PFC circuit provides exactly that.
There is a wealth of material available about the theory of operation of this converter, and it can be extremely confusing to follow. In particular, the small-signal model defies closed-form attempts to model it in closed-form equations. It is, therefore, a great candidate for swept control transfer functions without analysis or small-signal modeling. It is not our intent to rehash the theory of the converter, but rather to make reliable and useful control measurements.
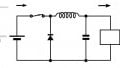
Figure 1 shows the transient simulation circuit for a sample LLC converter with an input range of 36 – 54 V and an output of 120 W at 12 V. The lower switching frequency was designed to be 200 kHz.

Figure 1. LLC Converter in LTspice®. Frequency Range 200-400 kHz. Vout = 12 V.
Figure 2 shows the circuit used to simulate the controller for this power stage. Notice that we chose to use an FM modulator for the VCO function, finding this to be faster to simulate than the normal ramp generation circuits. The actual implementation of the VCO differs from one control chip to another, but the basic function of converting a feedback signal into an oscillation frequency is the same.

Figure 2. LLC Controller with RidleyBox/AP310 Analyzer.
The steady-state operating point of the converter is set with the input source Vss which controls the operating frequency. The RidleyBox®/AP310 component injects a small ac signal on top of this dc value to vary the switching frequency. Modulation of this signal and measurement of the response from point C to point B of the circuit gives us the control-to-output gain of the power stage and the modulator.
LLC Converter Design Using Scaling Laws
Nicola Rosano produced a great webinar on the practical design of LLC converters which you can view in reference [3]. It is highly recommended that you watch this video to learn how to avoid endless mathematics and confusion in the design process for the LLC. Nicola has developed powerful engineering tools for generating rugged designs for the LLC using standardized curves.
We used these scaling law techniques to design the 120-W converter in this article, and the resulting component values are given in the circuit diagram of Figure 1.
The complete design process, including the curve shown in Figure 3 and two other design curves, is described in the recorded webinar. The webinar describes in detail the design process for several different diverse power stage requirements.

Figure 3. Impedance Curve Plot #1 of Nicola Rosano Used to Design the LLC Power Stage [3]
Simulation Settings for the RidleyBox/AP310 Emulator
The LLC converter presents many challenges to simulate cleanly, especially for frequency response characteristics. We found it essential to have the LTspice® simulation solver set to “Alternate” to be able to get meaningful results (not the default setting). We also use the following analyzer settings to produce the simulation results in this article.
The choice of 25 points per decade (from 300 Hz to 200 kHz) provided very smooth curves, although such a high number is not needed when first assessing the performance of your power stage.
As explained in [1], choosing the correct settings for the dwell time, bandwidth, and noise reduction parameters gives a perfect balance between speed of simulation and accuracy of the plots. Don’t underestimate the critical nature of these settings. If we did not have a lifetime of controlling analyzers as background experience, it is unlikely we would have been able to get LTspice® to perform as well as we have by introducing and adjusting these parameters. The complete setup of the LLC simulation circuits is fully automated by the version of RidleyWorks® [4] currently under development.

Figure 4. RidleyBox®/AP310 Analyzer Emulator Settings for LLC Power Stage Simulation. These settings produce high-resolution results. (Simulation time can be cut in half with lower resolution).
LLC Power Stage Control Transfer Functions
Figure 5 is the LLC power stage response for the 36-V low line input. This has the characteristics of a damped double pole just below 2 kHz and additional phase delay due to an RHP zero. The zero is indicated by the fact that the phase drops well below -180 degrees while the slope of the gain curve becomes less steep.

Figure 5. Frequency Response of the LLC Power Stage at Minimum Input Line.
Figure 6 shows the responses at the extremes of low and high line. In the power converter world, 36 V – 54 V is not a particularly wide range, but you can see considerable variation in response. The resonant frequency has moved out to about 8 kHz and is much less damped. You can also see that the RHP zero frequency has moved to a higher value as indicated by the improved phase and the steeper slope of the gain curve above 8 kHz. It is our intention to discuss a detailed interpretation of the curves in this article. We are simply trying to demonstrate that the curves can be cleanly and accurately generated through the transient simulation.

Figure 6. Frequency Response of the LLC Power Stage at Minimum and Maximum Input Line.
Finally, in Figure 7 we can see the complete family of curves from low line to high line. Here you can see the smooth transition of the resonant frequency, the changing Q of the double poles and the movement of the RHP zero as the line is increased. The change in the dc gain is also quite substantial – about 15 dB for a relatively small input line change. This is what we expect from LLC power stages.

Figure 7. Frequency Response of the LLC Power Stage Over Complete Range of Input Line.
The LLC circuit has extreme variations in its control-to-output characteristics with operating conditions. Sweeping the power stage with LTspice® is a very useful tool to produce expected characteristics with minimal work. With the right analyzer settings, the simulation times are very reasonable, and we strongly encourage using this important tool for all your frequency response needs.
References
1. High-Performance Loop Sweeps in LTspice®, Dr. Ray Ridley, Art Nace, John Beecroft, Ridley Engineering Design Center Article 113.
2. Transient Loop Sweeps Outperform Small-Signal Models, Dr. Ray Ridley, Art Nace, John Beecroft, Ridley Engineering Design Center Article 114.
3. Designing LLC Converters Using Scaling Laws Webinar by Nicola Rosano, Ridley Engineering Power Supply Design Center.
4. RidleyWorks® design software contains complete analyzer models with automated setups for your power supply application and for LTspice emulation of frequency-response analyzers.
5. Learn power supply design in our Hands-on Workshops for power supply design
6. Join over 5,000 engineers on our Facebook Power Supply Design Center group. Advanced in-depth discussion group for all topics related to power supply design.
7. Frequency Response Measurement Two-Hour Masterclass. An extended training session with live measurement examples on switching power supplies.
This article was co-authored by Dr. Ray Ridley, Art Nace and John Beecroft of Ridley Engineering, Inc.
This article originally appeared in Bodo's Power Systems Magazine.