Facebook
 Google
 GitHub
 Linkedin
MADMIX The Standard for Measuring SMPS Inductors
This article introduces the advantages and features of MinDCet's MADMIX for power electronics industry to consistently measure inductors in real operations.
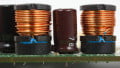
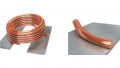
Power inductors are the beating heart of Switched-Mode Power Supplies (SMPS). Accordingly, they are in charge of the actual power conversion. They have a major impact on the performance parameters of the SMPS, such as the efficiency, dynamic behavior, power density, form factor and EMC.
Despite their crucial role, inductors historically are poorly understood components. Lacking accurate models for commercial inductors and previously no available equipment to do the modeling, the SMPS designer was left in the dark. On the other side of the table, the inductor manufacturers were not able to easily and consistently measure their products under real-life operating conditions. Sporadic, and often painstaking, measurements in the customer’s application brought some answers to performance questions, but not in a consistent and repeatable fashion.

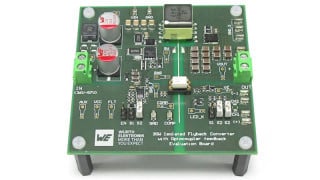
Figure 1: Complete setup
The MADMIX Accurate Inductor Measurement System provides the power electronics industry the solution for these questions and issues. Real-life, hard-switched operating conditions are applied to the Inductor-UnderTest (IUT), whilst simultaneous performance measurements are done: AC-losses, Inductance, Saturation... Figure 1 shows the complete setup, fully controlled by software and with an optional thermostreamer to facilitate ambient temperature variation.
Power Inductor Measurement: HOW NOT TO DO IT
In a typical SMPS circuit, such as a buck, boost and class-D converter, the typical hardswitched voltage over the inductor and the resulting triangular current through the inductor determine the power losses and transient behavior, see figure 2. Needless to say these waveforms greatly determine and affect the overall SMPS efficiency and performance. In contrast to these large-signal waveforms, conventional commercial inductor measurement equipment uses a small-signal approach. This is based on applying sinusoidal voltages and currents to the IUT to measure the inductance and to determine the equivalent winding resistance and capacitance. By applying a small-signal sinusoidal AC-voltage over the inductor, possibly combined with a DC-current offset, the core-losses are not measured to the right extent. The resulting small-signal model is not representative for use in the SMPS. Indeed, the SMPS designer using this model will end up with significantly larger power losses, resulting in reduced overall efficiency and performance, likely overheating the SMPS and potentially causing instability problems.

Figure 2: Hard-switched voltage over the inductor and the resulting triangular current
On the side of the estabished inductor manufacturers analytical models have been extensively used for many years. The modified Steinmetz equation (MSE), shown below, is probably the most known and used one for calculating core-loss.
The inherent limitations of MSE are: the need for experimental measurement data of the core material, necessary knowledge on the unique geometry of the inductor and the fact that core saturation is not taken into account.
Power Inductor Measurement: HOW TO DO IT RIGHT
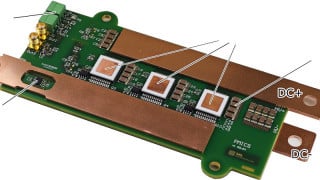
MinDCet has come up with a revolutionary way to mimic the typical SMPS inductor waveforms called MADMIX: “Method for Advanced DC-DC Convertor Design based on Macro-model Inductor Parameter Extraction”. This patented approach essentially allows for applying real-life, hard-switched operation conditions. An in-house developed power amplifier using state-of-the-art GaN power stages and in-house developed high-speed pre-driver ICs (see figure 3) allow applying: variable frequencies (10kHz-10MHz), duty-cycles (10%-90%), voltages (1V-70V), current-ripples (0-60A) and DC-currents (0-50A) on the IUT in a software-controlled, fully-automated fashion.

Figure 3: In-house developed power amplifier using state-of-the-art GaN power stages and in-house developed high-speed pre-driver ICs allow applying: variable frequencies
How Does it Work?
In each measurement point, featuring the specified frequency, dutycycle, voltage swing and DC-bias, the current and voltage through and over the IUT are measured in real-time. This key data allows for the calculation of the average inductance:
And the AC losses, which are distinguished from the DC losses, are calculated by means of:
Powerful Digital Signal Processing (DSP) in the MADMIX's software is used to post-process the raw measurement data. This effectively eliminates switching artefacts and other non-idealities that do not contribute to the actual power transfer in the IUT. To futher improve accuracy, the actual AC losses are calculated by integrating IUT voltage and current over time. In certain operating conditions this leads to a maximal resolution of 1mW in the AC power loss measurement. The AC losses incorporate both winding and core losses, which are separated analytically using Fourier transformation. An example of the AC losses as a function of frequency and at a fixed ripple current is shown in Figure 4.

Figure 4: AC losses as a function of frequency and at fixed ripple current
All the losses and the inductance can be measured and explored in the entire operating region of the inductor (and even beyond that!) The result is a large-signal and full-inclusive model, which can be used in the simulation environment of choice.
The Functionality
Fully-Automated Software: MAMIX loads the inductor under-test with a combined DC-offset and triangular AC current, having variable amplitude, frequency and duty-cycle. The powerful software with graphical user interface, depicted in Figure 5, behind the fully-automated measurement setup allows to automatically sweep one or more parameters for maximal user comfort.

Figure 5: graphical user interface
Saturation Detection and Measurement: The software automatically detects and flags even the slightest amount of core saturation. When it does the mean value of the “knee point” in the inductor current is given. In addition to the overall average inductance, two more values are displayed: the average inductance before and after saturation. Hence, a piecewise linear model can be derived that takes magnetic saturation into account.
Saturation curves: As shown in figure 6, the more common saturation curves vs DC-current bias can also be measured. The big difference with LCR-based measurements is the fact that the ripple added to the DC-bias is not a small-signal sine wave. The resulting curve will tend to show lower overall inductance and saturation kicking in faster. But in the end this is also what will happen in the application.

Figure 6: Common saturation curves vs DC-current bias
Coupled inductors measurement: The software features the measurement of coupled inductors by means of an open-short measurement of the secondary winding. As a result the large-signal coupling factor and the AC losses can be effectively measured. By doing so fly-back, forward, SEPIC… type converters and even wireless powering converters are supported.
Temperature Prediction: Seconds suffice to measure the core and DC losses in a certain operating point, with prediction of the steady-state temperature of the IUT. Even operating points that would normally destroy the DUT in steady-state operation can be measured, without being destructive. Definitely, with a maximal input power of 1600W destructive test are possible. This way the user immediately gets a feel if the part is still in a safe operating conditions and would not overheat during continuous use. Temperature Control: Real-life operating conditions imply varying ambient temperatures, having an impact on the electrical parameters of the inductor, including the overall inductance, saturation and losses. To accommodate these measurements a thermo-streamer unit is used to vary the ambient temperature of the IUT in a matter of seconds.
The Added Value
The MADMIX setup allows performing an accurate prediction of the efficiency and overall performance of SMPS designs, even before drawing a single transistor in an IC lay-out or before routing the SMPS PCB. This way the performance of various commercial inductors, and new inductor designs, can be determined beforehand. MADMIX provides a clear insight into the important trade-offs in SMPS design: cost-size-efficiency-performance. Furthermore, in some niche applications the right off-the-shelf inductor does not exist. In such case MADMIX allows to prototype inductors with specific form-factors, temperature ranges (eg. until 225°C!)
About the Author
Mike Wens is the Co-Founder and CEO of MinDCet, a fabless IC design company, with expert-level competences in the field of fully- and highly-integrated, ultra efficient switched-mode voltage converters, control systems and on-chip power and battery management. He holds a Master's Degree in Micro-Electronics and Master's Degree in Electrical Engineering earned at the Karel de Gore-Hogeschool and KU Leuven respectively.
Jef Thone is the Co-Founder and CTO of MinDCet, a fabless IC design company, with expert-level competences in the field of fully- and highly-integrated, ultra efficient switched-mode voltage converters, control systems and on-chip power and battery management. He is experienced in the design of sensor interface ASICs for automotive applications, high-voltage chip design, analog & mixed-mode chip design, PCB design, FPGA prototyping, high-data rate near-field telemetry. He holds a Master's Degree in Electronics Engineering and a PhD in Electronics.