Facebook
 Google
 GitHub
 Linkedin
Data-Driven Maintenance Planning for Variable Speed Drives
ABB has developed a condition-based maintenance approach for variable speed drives. Operating in the cloud, the data-driven methodology can identify the risk of potential component failures one to two years ahead.
Over a number of years, discussions with users of variable speed drives (VSDs) in critical applications in the oil and gas, metals, water and wastewater, and pulp and paper industries, had revealed that they wanted an approach that went beyond their current time-based, preventive maintenance programs. They knew that some drives in their fleet were probably overloaded and there was a risk of failure before the scheduled replacement date – creating potential issues with unplanned shutdowns and lost production. Equally, some drives, having reached the end of their nominal service life, could still have many years of life left. But without any way of measuring the asset’s health, they could not take the risk and had to replace the drive components anyway.
To address this challenge, ABB embarked on the development of a data-driven condition-based maintenance approach. The aim was to take the guesswork out of scheduling drive repair and replacement activities by building a clear picture of how drives are actually aging over their time in service.

Figure 1: Blue shading indicates the nominal life of a VSD while the blue line shows the predicted life.
Aging of the Key Drive Components
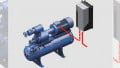
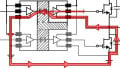
The starting point was to look at the key components in a drive – the fan, the semiconductor converter module, and the DC link capacitors – and how they age. The main common aging factor is the temperature at which they operate:
-
The lifetime of the main cooling fan is limited by the consistency of the bearing grease. Grease liquefication due to high temperature is the prime cause of bearing aging. So, the air inlet temperature of the fan is a key factor in the aging of the fan itself.
-
Semiconductor components have a thermo-mechanical aging mechanism related to temperature cycling. In a drive converter module, temperature cycling is induced by the loading of the drive. Variable loading causes thermal cycling which eventually results in component failure.
-
The lifetime of the DC link electrolytic capacitor can be limited by the electrolyte. An internal temperature rise in the capacitor accelerates the electrolyte vaporization and diffusion out of the capacitor. This causes an increase in equivalent series resistance (ESR) and a decrease in the capacitance, eventually leading to capacitor failure. The capacitor lifetime depends on the hot-spot temperature of the capacitor and the applied voltage.
Data Collection Via the Cloud
An advantage of modern VSDs is that they already incorporate thermal, voltage, and power sensors that collect data on the ambient temperature and load variations of the components, as this is essential for their normal operation. The actual amount of data generated by a drive is huge – with point measurements made at intervals of one second, a single drive might generate 200 gigabytes (GB) a year. Until recently, collecting this level of data and analyzing it would have been impractical. The advent of cloud computing has proved to be a game-changer in this respect.
Cloud-based algorithms and statistical analysis
Once a method of obtaining the raw data had been established, the next step was to determine how to interpret the information to obtain a life prediction. ABB worked with its component manufacturers to obtain life prediction curves based on L10 probability. In simple terms, the L10 life calculates how long 90 percent of a group of apparently identical components will last when subjected to the same operating conditions. In other words, 10 percent of this sample group of components is expected to fail before they reach their specified L10 life.
The L10 curves were used to develop cloudbased algorithms which process the stress information obtained from the components to estimate their remaining lifetime. The details of the individual components were then used to build an algorithm to predict the life of the VSD. Figure 1 shows how this works in practice on a graph that plots available lifetime against calendar time.
The shaded blue area indicates the nominal life expectancy of the VSD – a gentle slope over 25 years. In contrast, the steeply descending blue line shows the anticipated life under its current stress conditions. Clearly, the drive is predicted to fail when the line crosses the x-axis – some time in mid 2025. Added to the curve are two alarm points – a yellow line that indicates when component replacement should be planned and a red line indicating when the component must be replaced to avoid failure.
This analysis can indicate potential failure up to two years ahead, helping reliability managers to understand why maintenance should be booked for a particular time. The three key drive components covered by the stress analysis are field-replaceable items, and the work could be carried out by a suitably skilled in-house maintenance team.
The data produced by the stress analysis can also be shown in the form of a daily lifetime impact chart, as shown in Figure 2. This helps reliability managers understand if plant setting optimization might be carried out to extend the lifetime of the drive components.

Figure 2: Analysis of the daily lifetime impact of the load on the drive operation.

Figure 3: Condition-based maintenance analysis showing that the drive components are lightly loaded.
The condition-based maintenance analysis can sometimes bring very good news. Figure 3 shows the actual life curve for a drive with components under lower than usual stress. In this case, the algorithms have estimated how much the maintenance can be delayed in comparison to the normal preventive maintenance plan (the blue area in the chart). Considering that the aging curve calculation is based on the L10 method, reliability managers can decide to take reasonable data-driven risks and extend their plant production as well as planning their maintenance shutdowns more efficiently to minimize downtime.
Viewing of Maintenance Needs
The condition-based maintenance tool provides a dashboard that enables reliability managers to see easily the information needed to plan their next maintenance task. The table of the remaining lifetime of the components clearly shows which drives will need maintenance within one or two years. The pie chart provides a clear view of the maintenance needs for the complete fleet and helps plan maintenance shutdowns. If the pie chart is completely green this means that no maintenance will be needed within the next two years.
If a component is changed, the reliability manager can insert the time of maintenance into the portal. The lifetime plan is then re-calculated accordingly.

Figure 4: The dashboard provides an immediate overview of the maintenance needs of the complete fleet of drives.
Cost Optimization for a Drive Fleet
The condition monitoring service for drives has been designed to be scalable to allow maintenance managers to tailor it to meet their specific needs. For example, critical drives could be protected by condition-based maintenance while less critical drives are given more basic condition monitoring, which are sufficient to follow the equipment’s general parameters and stress level. The service has been developed initially for ACS800 and ACS880 low-voltage air-cooled industrial drives. It enables the failure of a drive component to be predicted one or even two years ahead, optimizing maintenance planning and avoiding costly emergency maintenance in case of failure.
An Early Success in a Practical Application
The condition-based maintenance service had an early practical trial with a major customer in the steel processing industry. The converter module in a drive operating the rolling mill was identified as working at a high-stress level. The lifetime estimate showed that the component had reached its remaining useful lifetime. At that point it was not replaced, and four months later it failed. Following its replacement, the condition-based maintenance analysis indicated that the newly installed converter operating in this type of cyclic application requires changing of the power module in seven years to avoid unexpected failure. This was exactly the timescale in which the original converter power module had failed.
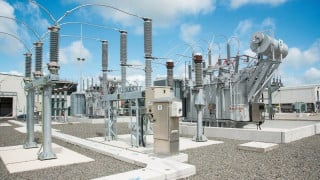
Monitoring the World’s Largest Free-Fall Simulator
Aero Gravity in Milan, Italy, is the world’s biggest free-fall simulator. It enables flyers to experience the thrill of free-fall in a 21-meter high and 5-meter wide transparent tube. The six 400 kilowatt (kW) fans creating the air updraft are each operated by asynchronous three-phase electric motors and VSDs. With a touch of a joystick, the drives enable the wind tunnel operator to regulate the airflow to meet the needs of the flyers in the chamber – ramping up from 120 km/h to a peak of 370 km/h and back down in a matter of seconds.
To meet the highest safety standards, Aero Gravity uses cloud-based condition monitoring for the drives. The service continuously monitors the status of the drives, collecting data on key parameters such as abnormal temperatures and incorrect operations. The server analyses the data and provides an overview through a dashboard to identify areas that may need extra attention. The service gathers valuable feedback every day that helps the maintenance team at Aero Gravity to take corrective actions. This reduces thermal stress on the equipment, which will result in longer life and improve its overall efficiency while helping to maintain comfortable temperatures for the flyers in the chamber.
Neutral Network Computing
Harnessing the combined power of cloud computing, machine learning and deep knowledge of drives have enabled the development of a data-driven condition-based maintenance approach that supports highly targeted maintenance actions for critical drive applications. The next step in this approach will be to use neural network computing to take the data-driven analysis a stage further to develop a greater understanding of patterns and anomalies. This will provide an even earlier warning of potential issues so that appropriate maintenance actions can be scheduled to prevent any risk of unplanned process downtime.
About the Author
Stefano Legnani works as the Global Remote Services Product Manager of ABB Semiconductors since August 2003 where he is responsible for the ABB Drives Business Unit of the services products; Supporting ABB’s local business units globally in growing their remote service business and managing the digital service business development, aligning own visions to company visions and market trends.
This article originally appeared in the Bodo’s Power Systems magazine.