Facebook
 Google
 GitHub
 Linkedin
Measuring Effects of Solar Fluctuations on PV Output
Researchers have devised a method to measure solar irradiance fluctuations between disparate geographic locations using data from a desert and the middle of the ocean.
As solar photovoltaic (PV) capacity additions continue to skyrocket worldwide, the power industry faces new challenges in balancing inconsistent generation depending on cloud cover and solar irradiance patterns.
Scientists from the Ben-Gurion University of the Negev in Israel and Japan’s Okinawa Institute of Science and Technology are exploring ways to predict changes in solar PV energy production. They developed a method to analyze PV output variations over time and power fluctuations across regions.
This is especially relevant as solar’s share of global electricity is growing worldwide. The industry added 444 GW of new capacity last year, up 76% from 2022. Analysts expect global installations will exceed 520 GW in 2024.
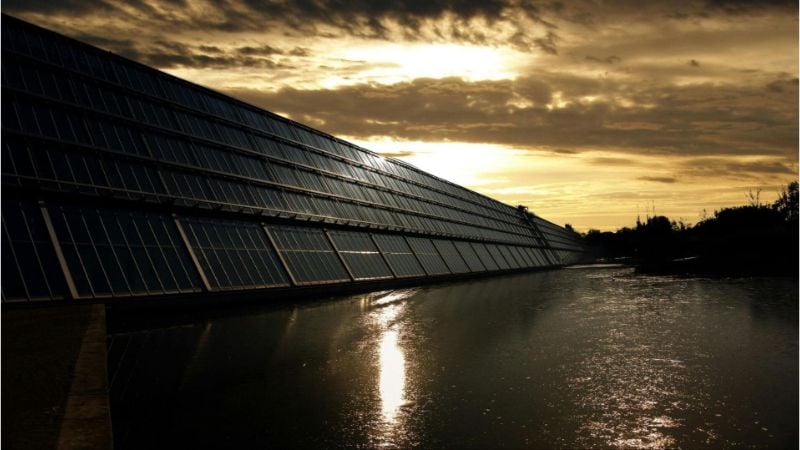
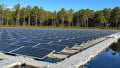
Solar panels near water. Image used courtesy of Pexels
However, power grids often have insufficient storage capacity to balance fluctuations from intermittent renewables. Global cumulative energy storage capacity reached about 42 GW/99 GWh in 2023, driven by government investments spurring auctions and utility projects. However, long-duration energy storage remains limited, with only 1.4 GW/8.2 GWh of capacity commissioned last year. Most storage installations since 2020 (85%) are concentrated in the Asia Pacific region.
Power Spectrum Analysis and Radiation Intensity
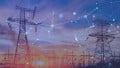
Smart grids and sensors can help monitor supply and demand and reroute power when necessary, but predictions are required to devise an effective network design strategy boosting grid stability.
The researchers focused on analyzing the power spectrum, which indicates changes in PV output. This metric gauges generation fluctuations across individual plants and time scales. However, due to intermittent production, cloud cover and dust particles present significant limitations in accuracy.
In past studies, the researchers used the clear-sky index to measure solar generation changes across geographies. Typically used in meteorology, this index shows the amount of solar radiation reaching Earth under clear conditions, alongside the impact of clouds, aerosols, and atmospheric turbulence.
Solar irradiance fluctuations contain a power-law spectrum with two slopes in the intermediate- and high-frequency ranges. The spectrum combines a latitude-dependent variation in the length of daylight and a stochastic (random probability) component from environmental factors. The researchers described a new approach to unpacking the solar-irradiance time series in two parts: stochastic environmental attenuation signals and deterministic location-based clear-sky measurements.
This approach allowed the team to analyze solar power fluctuation spectra after considering geographic dependence. The analysis for two locations found that the stochastic environmental factors determine the spectral power-law slope in the high-frequency range, while the clear-sky signal indicates intermediate frequencies.
No baseline standard had been established before this study to compare spectra between disparate locations.
Clear-Sky Signals
Clear-sky signals are based on the location’s latitude and the duration of daylight. However, other factors, such as environmental conditions impacting air quality, are harder to predict.
The researchers measured clear-sky and solar radiation signals using sensor data from the Midreshet Ben-Gurion school in southern Israel’s Negev desert and a mid-ocean buoy at the equator in the Indian Ocean. They discovered frequent solar radiation fluctuations were related to unpredictable environmental changes, but intermediate changes were linked to clear-sky patterns.
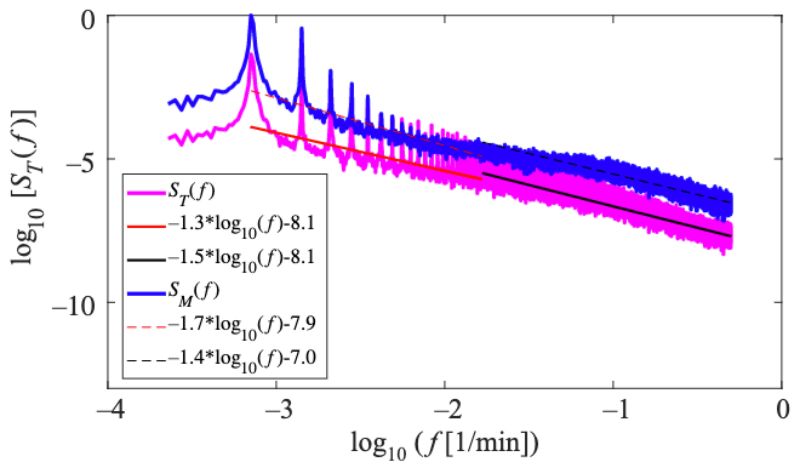
Graph for the Negev desert location: The solid blue line shows a power-law decay for intermediate (solid red) and high frequencies (solid black). The attenuation spectrum includes a power-law spectral decay for intermediate (dashed red) and high frequencies (dashed black). Image used courtesy of the study’s authors (Figure 3)
The site at Midreshet Ben-Gurion was about 1,607 feet above sea level, while the buoy floated right at sea level. The desert location collected one-minute samples over a year, providing a dataset with 525,600 points. They sampled the equator time series at two minutes across one year, with 262,000 data points. The researchers compared these datasets to clear-sky irradiance calculations based on the Haurwitz model, which covers time, location, and altitude without environmental attenuation factors.

Data for the equator location: Normalized clear-sky spectrum (green) shows power-law decay for intermediate (dotted red) and high frequencies (dotted black). The solid blue line shows the measured spectrum with a power-law decay for intermediate (solid red) and high frequencies (solid black). Dashed red and black lines show both frequencies’ attenuation spectrum and related decay. Image used courtesy of the study’s authors (Figure 4)
The researchers noted environmental attenuation fluctuations in the high-frequency range of the solar irradiance spectrum were more likely to even out under geographic smoothing to help suppress short-term intermittent grid-level fluctuations. Still, location-based fluctuations determining spectral data at intermediate frequencies could continue regardless of geographic smoothing.
The researchers plan to unlock more insight into the magnitude of this smoothing effect by studying how solar PV plant size and energy absorption influence generation at different sites. This would reveal why energy fluctuations vary across locations.