Facebook
 Google
 GitHub
 Linkedin
How Does Weather Affect PV System Degradation and Performance?
Researchers collected data on an unprecedented sample size of solar systems in the U.S., yielding some interesting findings on extreme weather and long-term degradation.
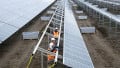
Solar photovoltaic (PV) systems are built to last for decades, but exposure to the elements and minor losses in energy production can accumulate over time. The National Renewable Energy Laboratory (NREL) spent four years analyzing data to shed light on this topic, which lacks an industry-wide consensus due to inconsistent performance metrics and manufacturer-specific system variations.
The dataset includes an unprecedented net of 25,000 inverters across nearly 2,500 commercial- and utility-scale projects in 37 states and territories. This covers about 11% of the U.S. solar fleet—or 8 of 72 GW. The mean age of these systems was five years.
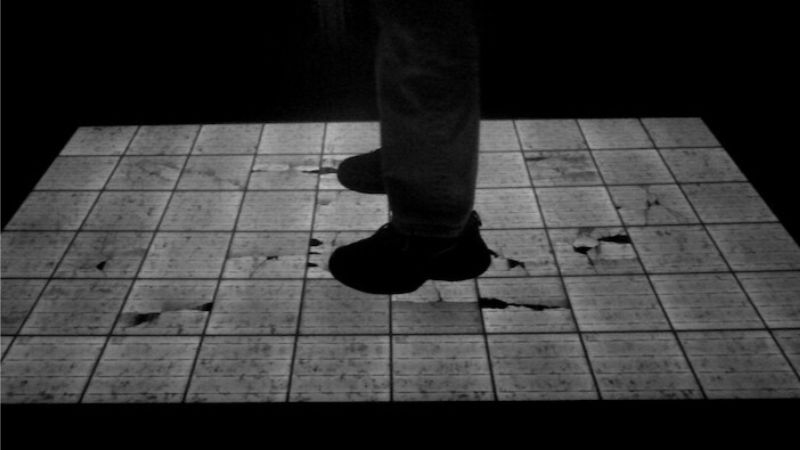
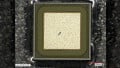
An electroluminescence image of a person creating cracks in an NREL test solar panel. Image used courtesy of NREL
Short-Term Weather Impacts on PV Systems
To study the consequences of hail, flooding, wind gusts, lightning, wildfire, and other natural conditions, NREL compared the dataset to a map of extreme weather records compiled by the National Oceanic and Atmospheric Administration. The researchers considered how extreme weather occurring within 6.2 miles impacted each system’s performance.
Most systems in the set only had one weather-related outage, primarily tied to flooding or rain followed by high winds. Short-term outages from floods damaging inverters or wind gusts hitting modules had a minimal effect on most systems.
The median outage length was two to four days after a storm, with a 1% annual loss in performance. Only 12 out of the 6,400 systems studied between 2008 and 2022 experienced outages longer than two weeks.
These temporary effects may not seem significant, but considering them alongside mechanical stresses from hail, wind, and snow loading tells a different story.
Long-Term Impacts and Weather-Related Stress
While the average storm is unlikely to inflict much damage, weather events above certain thresholds are associated with higher annual performance losses. Those caps include the following.
- Hail larger than 25 millimeters (mm) in diameter
- Winds over 56 miles per hour (mph)
- Snow loads deeper than 3.2 feet
Below these parameters, losses are otherwise comparable to the PV fleet average.
Interestingly, NREL observed weaknesses among systems with modules qualified with the International Electrotechnical Commission (IEC) 61215, a standard that tests for resistance to the impact of hail with a 25 mm diameter. When struck by the same-sized hail in field settings, these systems displayed higher performance loss rates, suggesting that testing standards may require updating.
In a paper outlining its findings, NREL mentioned that a stricter IEC hail testing qualification is being developed. For now, it’s published as a technical specification (TS 65597).

Examples of PV system damage. Image used courtesy of NREL (Page 4)
Meanwhile, among systems damaged by winds over 56 mph, some parts of the installation avoided impact because of the site’s layout. Nearby walls, buildings, or other structures can provide noticeable wind protection.
Mounting configuration can also impact how much wind the installation is subjected to. For example, installing the array near a high wall could shield it from winds more than an exposed configuration.
Performance Losses
While exposure to the elements is a common reason for degradation, a range of factors can influence performance loss rates over time. NREL stressed the importance of quantifying this metric, as it is used in nearly all agreements that finance solar projects and provides guidance for technical expectations.
Nationally, the median performance loss was 0.75% annually. Systems installed in hotter climates exhibited an 0.88% annual drop in performance, nearly twice as much as those in colder climates (0.48% per year).

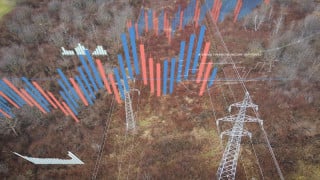
A histogram of performance loss rates in the PV fleet dataset. Image used courtesy of NREL
Silicon and cadmium telluride systems performed similarly to all fixed-tilt systems. High-efficiency modules displayed median losses comparable to conventional silicon technologies.
Storm-Hardening Recommendations
NREL emphasized that more rigorous testing standards are needed so that solar companies can understand the thresholds at which damage can occur by subjecting panels to realistic stresses.
Researchers also warned that recent design trends like thinner cells, thinner front glass, and bigger modules may increase the likelihood of system vulnerability if not tested and designed correctly. Reviewing maintenance and operation records and monitoring PV assets would be a more proactive approach to detecting degradation among new module designs.
NREL assembled a set of pre-storm checklists intended for utilities and independent power producers who own or operate solar PV installations. Depending on the system, electrical-specific steps generally require checking connectors, wiring, supports, and waterproofing.
For example, in utility-scale ground-mounted systems, electrical staff should examine cable connections for corrosion, ensure the J-box is securely attached to the module, and check the grounding system for the tightness of connections and electrical continuity, among other considerations. It also suggests replacing parts like DC system wiring, cable materials, and enclosures. Waterproofing involves checking gaskets, conduit fittings, and seals to prevent wind-swept rain, then tightening or applying outdoor-rated sealant if necessary. Installing a weep hole in the bottom of the enclosure can also prevent moisture from escaping.