Facebook
 Google
 GitHub
 Linkedin
Energy Price Volatility Could Hit Manufacturing Hard
With energy price swings becoming more common, the manufacturing sector faces more pressure to upgrade its efficiency and hedge risk exposure.
Price volatility has been a consistent trend across the United States’ energy economy in recent years. Though energy markets characteristically operate in cycles, the high and low swings of post-COVID electricity prices are hitting one of the biggest end-consumers: American manufacturing facilities.
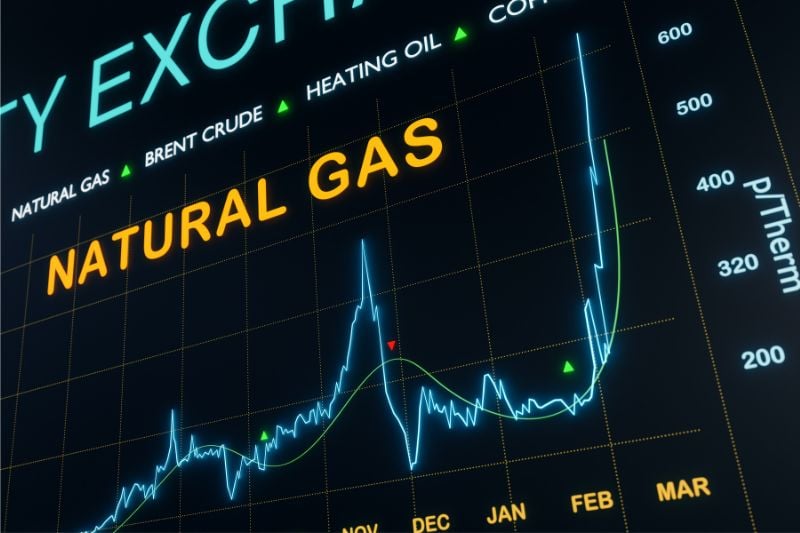
Energy price volatility. Image used courtesy of Adobe Stock
According to the U.S. Energy Information Administration (EIA), 33% of U.S. energy consumption comes from the industrial sector. And manufacturing consumes the largest share of industrial energy at 81%, compared to 9% in mining, 6% in construction, and 3% in agriculture.
Already-volatile energy prices came to a head last year when a few U.S. factories shuttered—or faced the threat of doing so—when companies couldn’t pay for electricity. The country’s largest primary aluminum producer, Century Aluminum Company, announced last summer it would temporarily idle its Kentucky smelter facility until energy costs stabilize. Bloomberg reported in July (citing an unnamed industry executive) that at least two steel mills had started suspending some operations to cut energy expenses.
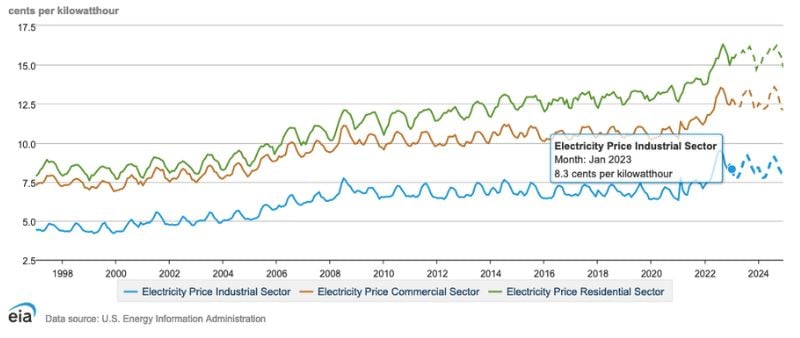
Historical and projected monthly electricity prices in the industrial (blue line), commercial (orange), and residential (green) sectors, dating back to 1997. Image used courtesy of the EIA
Rising energy prices are cuffing the bottom lines of leading industrial players. Pennsylvania-based US Steel, one of the country’s largest steel producers, cited this among the reasons its flat-rolled steel segment declined last year. Pre-tax/interest earnings in this segment, representing a dominant share of its business, fell from $2.6 billion in 2021 to $1.9 billion in 2022. In its 2022 annual report, the company mentioned higher energy costs of around $365 million as one of the primary causes of that drop.
Some firms are hedging their risks to price shocks. Another American steel giant, North Carolina-based Nucor, mentioned deep in its 2022 annual report that it sells natural gas produced by its operations to third parties to limit its exposure to fluctuating energy prices consumed by its U.S. facilities. It also periodically uses derivative financial instruments to hedge its exposure to natural gas risks.
Natural Gas Price Fluctuations
The industrial sector consumes most of its energy from natural gas, a major driver of overall wholesale electricity prices since it’s usually the most costly fuel for electricity generation. Last year, natural gas prices increased for domestic customers because high international demand caused a rise in liquified natural gas (LNG) exports.
Consequently, natural gas prices rose from $3.70 per million British thermal units (MMBtu) in January 2022 to nearly $10 per MMBtu by late August. Some of this volatility stemmed from demand shifts due to extreme weather events. But the higher prices were also partly tied to limited coal availability to offset higher-priced natural gas.
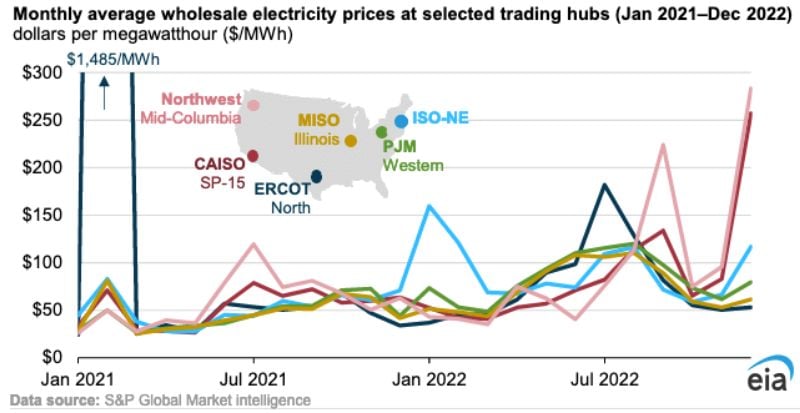
Monthly wholesale electricity prices in 2021 and 2022. Image used courtesy of the EIA
Barring day-to-day volatility, the market may stabilize as costs are projected to decline in the coming months. The EIA expects the price of natural gas—which accounted for 39% of all electricity generation last year—will average less than $3 per MMBtu in 2023, falling more than 50% from 2022 as natural gas inventories begin to rise this quarter.
Natural gas prices aside, electricity consumption in the manufacturing sector will only increase in the next few decades as the adoption of electrification intensifies and the grid becomes increasingly weighted towards renewables. The EIA’s 2023 Annual Energy Outlook projects that industrial energy consumption will rise as much as 32% through 2050. This figure includes total electricity use and electricity-related losses.
Energy Efficiency
These trends have more companies looking to offset their natural gas consumption with energy-efficiency upgrades and renewable integration.
Experts are encouraging factories to manage the risk factors they can control: Lowering their electricity output long-term. Paul Leanza, the director of gas supply for Ohio-based retail natural gas and electric supplier IGS Energy, recently outlined some critical steps for doing so in a Manufacturing.net article. Leanza advised gathering feedback on energy usage trends from operations, maintenance, and finance teams and using real-time monitoring platforms to benchmark energy consumption data.
These steps can go hand-in-hand with replacing aging equipment, adding occupancy sensors, and installing efficient LED lighting. Another suggestion is to understand how peak demand factors into monthly billing cycles—capacity cost generally accounts for half of a plant’s power bill, defined as the amount charged when operating on peak power throughout the billing period.
Energy Cost Impact on Manufacturing
An interesting gauge of energy volatility’s impact on manufacturing inflation is S&P Global Intelligence’s Purchasing Managers’ Index (PMI), a global manufacturing survey studying the trends driving factory input costs and selling prices. Every month, the survey paints a different picture of the role of energy price fluctuations in this equation, suggesting a turbulent market.
For example, the September 2022 PMI update showed that energy-fueled cost increases had skyrocketed to a new high in the survey. The number of companies reporting energy-driven input costs increased to 4.7 times the long-run average—the highest in nearly two decades.

March 2023 data from S&P Global’s worldwide manufacturing PMI survey reveals an easing of energy prices on manufacturing price pressures. Image used courtesy of S&P Global Market Intelligence
Two months later, S&P's November report indicated that the outlook for industrial prices hinged on energy market developments, as volatile trends would likely continue to bring upside and downside risks to manufacturing costs, barring developments with the war in Ukraine, winter temperatures, and China’s COVID policies.
Fast-forward to March 2023, and energy was the second-lowest pressure on input costs, behind raw material prices. Still, that level is over two times the long-run average, albeit an improvement from last year’s peak of nearly 12 times the average.