Effectiveness of Phase Correction When Evaluating High-Efficiency Motor Drive
This article discusses the characteristics of inverter output waveforms to outline requirements for power measuring instruments.
Against the backdrop of international efforts to prevent global warming, the increasingly efficient motor drive systems used in electric vehicles and industrial applications have been attracting attention in recent years. Essential in evaluating the efficiency and loss of motor drive systems, the ability to measure power accurately demands a range of expertise.
Introduction
This article focuses on the characteristics of inverter output waveforms in order to outline requirements for the power measuring instruments that are needed to accurately measure inverter output power. It also introduces phase correction by a power analyzer with a focus on current sensor phase error in order to satisfy those requirements. Finally, it reports on the authors’ verification of the effectiveness of current sensor phase correction.
Characteristics of inverter output waveform
Principal components of inverter output power include a fundamental frequency component (up to 2 kHz), its harmonic components, the switching frequency (5 kHz to 100 kHz), and its harmonic components. Of those, the fundamental frequency component is dominant. Figure 1 illustrates an inverter output’s line voltage waveform, line current waveform, and associated FFT results for a typical motor drive system. Table 1 provides detailed information about the measurement target.
Looking at the voltage FFT results, it is possible to observe the fundamental wave that is the principal component of the line voltage PWM waveform and its harmonics, along with the switching frequency and its harmonic components. A spectrum of at least 0.1% f.s. exists up to approximately 2 MHz.
The fundamental wave, its harmonics, the switching frequency, and its harmonic components can also be observed for the current waveform. However, the observed spectrum at frequencies of 100 kHz and above falls below 0.1% f.s., and the current level falls abruptly as the frequency increases. This phenomenon can be explained by considering the equivalent circuit of a motor that is connected to an inverter as a load (Figure 2). The motor’s winding can be thought of as an R-L load consisting of a resistance and inductance connected in series. Consequently, impedance grows at high frequencies, making it harder for current to flow.
Similarly, if we look at the power factor (cos θ) for the power of an R-L load, the power factor approaches a value of 1 when the frequency is low, for example for the fundamental wave and its harmonics. However, because inductive reactance becomes dominant at high frequencies such as the switching frequency and its harmonics, current exhibits lagging phase, resulting in a low power factor.
The bottom half of Figure 3 provides an enlarged view of the time axis for the inverter output voltage and current waveforms up to the switching frequency region. The voltage waveform is rectangular, while the current waveform is triangular. It is apparent that their phase relationship is characterized by the current’s lagging phase, as described above, resulting in a low power factor.
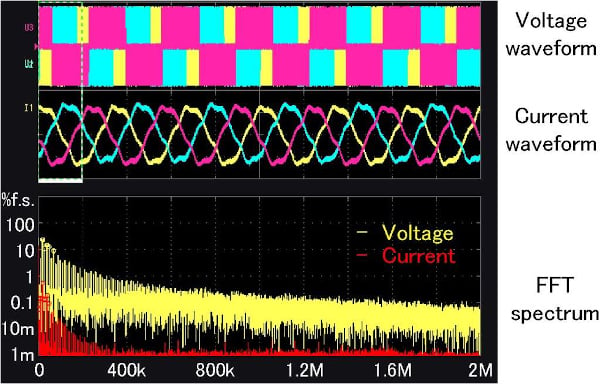
Figure 1: Waveform and FFT results for an inverter-driven motor (measured using the Hioki Power Analyzer PW6001)
Inverter |
Motor |
|||
Switching
|
Switching
|
Inductance |
Resistance |
Rated Power
|
SiC-MOSFET
|
20kHz |
3.6 mH |
0.9 Ω |
120 W |
Table 1: Measurement target specifications
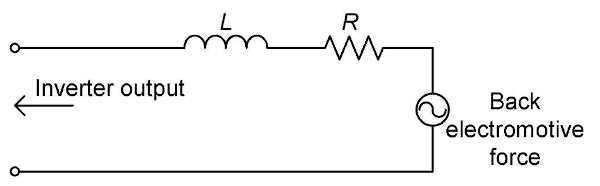
Figure 2: Motor equivalent circuit (for 1 phase)

Figure 3: Enlarged view of inverter output waveforms
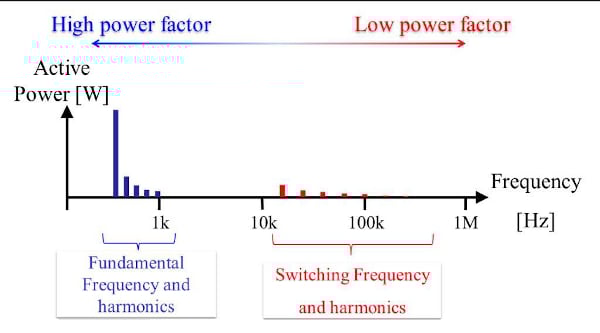
Figure 4: Principal components of inverter output active power and their characteristics
Performance required for high-precision measurement of inverter output
This section describes the requirements that a power measuring instrument must satisfy in order to accurately measure inverter output power. Based on the characteristics described above, it is important that such an instrument be capable of measuring active power not only for a high-power-factor fundamental wave and its harmonics, but also for a low-power-factor switching frequency and its harmonic components.
Figure 5 illustrates the relationship between phase error and active power error at different power factors. Voltage and current phase error in the measurement circuit has a greater effect on active power at low power factors than at high power factors. Consequently, accurate measurement of active power at the switching frequency and its harmonic components requires both flat amplitude characteristics and flat phase characteristics across a broad frequency band (the latter being particularly important). For power components that consist of a rectangular-wave voltage and triangular-wave current as shown in Figure 3, the frequency band across which the instrument must exhibit flat amplitude and phase characteristics in order to measure efficiency at a precision of 0.1% is likely 5 to 7 times the switching frequency1).
Active power frequency characteristics at a power factor of zero provide a yardstick for measuring flat amplitude and phase performance. Figure 6 provides example active power frequency characteristics at a power factor of zero for several Hioki Power Analyzer models. Please note that these example characteristics describe the instruments’ standalone performance.
The PW6001 delivers flat characteristics up to 1 MHz, reflecting its envisioned use case of measuring inverters that use SiC switching elements.
The PW3390, which is designed to measure inverters that use IGBT switching elements, provides flat characteristics up to 150 kHz. The instrument is designed to surpass the performance of the 3390, the previous-generation model, in order to facilitate high-precision measurement of inverter output.

Figure 5: Relationship between phase error and active power error at different power factors
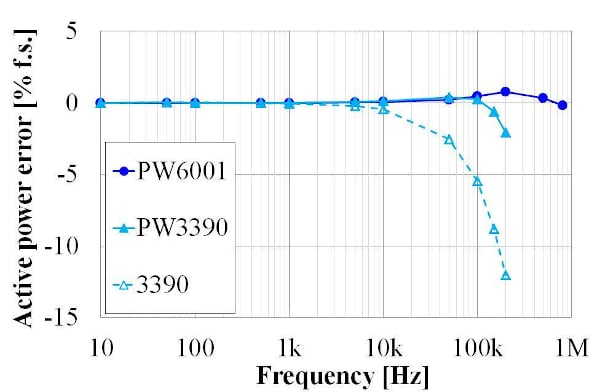
Figure 6: Example active power frequency characteristics at a power factor of zero for Hioki Power Analyzers
Current sensor phase correction
When a power analyzer is used in a high-precision power measurement application, it is typical to utilize a current sensor to measure currents that exceed 5 A2). Consequently, in order to implement a power measurement system whose flat amplitude and phase characteristics extend to high frequencies, it is necessary to satisfy the above performance requirements not for the power analyzer on a standalone basis, but rather when the power analyzer and current sensor are used in combination.
However, current sensors typically exhibit gradually increasing phase error in the high-frequency region due to the characteristics of the sensor’s magnetic core and circuitry. Furthermore, differences in the design of various sensor models cause the magnitude of this error to vary. Figure 7 illustrates example phase characteristics for several Hioki high-precision current sensors.
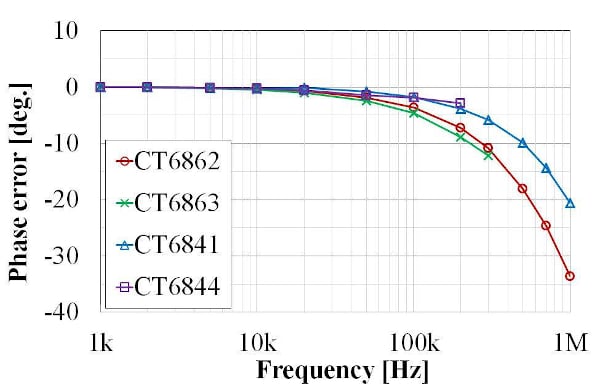
Figure 7: Current sensor phase-frequency characteristics
The current sensor phase correction functionality provided by the Hioki Power Analyzer PW6001 and PW3390 can be used to resolve this issue. Phase correction uses current sensor-specific phase error information to correct the error, thereby improving phase characteristics in the high-frequency region and reducing power measurement error.
The phase correction function utilizes virtual oversampling technology to perform real-time de-skew processing for sampled waveforms at a high time resolution equivalent to a frequency that is 400 times higher than the actual sampling frequency. By performing delay compensation for waveforms using the concept of time, phase correction benefits can be extended across the full frequency band.
Hioki develops high-precision current sensors in-house, and it has ascertained the phase characteristics of each sensor model by optimizing design and manufacturing processes and by implementing strict production control. The current sensor-specific phase characteristics information used in phase correction can be found in the user manual of each Hioki power analyzer. Figure 8 illustrates the result of performing phase correction for the current sensors shown in Figure 7 using that phase characteristics information. Performed properly, phase correction yields significantly better phase characteristics in the high-frequency region.

Figure 8: Phase-frequency characteristics following phase correction
Comparison of actual inverter efficiency measurements
The authors measured the efficiency of the SiC inverter described in Table 1 above using three Hioki Power Analyzer models and compared the results. Table 2 summarizes the measurement conditions. Separate measurements using the PW6001 and PW3390 were performed with phase correction enabled and disabled.
Figure 9 summarizes the measurement results for efficiency and loss. Both the PW6001 and PW3390 yielded efficiency values that were 0.1% to 0.15% greater than the 3390 with phase correction disabled. The difference in values was likely due to the instruments’ superior active power frequency characteristics at a power factor of zero (Figure 6).
Efficiency values with phase correction enabled were another 0.1% to 0.15% greater than those obtained with the function disabled. Figure 10 illustrates the DC input power P4 and the PWM output power P123 for the measurements shown in Fig. 9. Whereas the P4 values from the PW6001 and PW3390 remained unchanged regardless of whether phase correction was enabled or disabled, P123 values were 0.1% to 0.15% greater when phase correction was enabled compared to when it was disabled. Based on these results, the reduction in the CT6862 current sensor’s lagging phase error (Figure 7 and Figure 8) is readily apparent in the P123 measured values.
| Item | Model | |||
| PW6001 | PW3390 | 3390 | ||
| Input (DC) |
Wiring | 1P2W | ||
| Current Sensor | CT6862 | |||
| Phase Adjust |
OFF / ON (-10.96deg@300kHz) |
N/A | ||
|
Output |
Wiring | 3P3W3M | ||
| Current Sensor | CT6862 x 3 | |||
| Phase Adjust | OFF / ON (-10.96deg@300kHz) | N/A | ||
| Fundamental Frequency |
100Hz | |||
| Power Analyzer Frequency Band |
~2MHz | ~200kHz | ~150kHz | |
Table 2: Measurement conditions

Figure 9: Comparison of inverter efficiency and loss by model
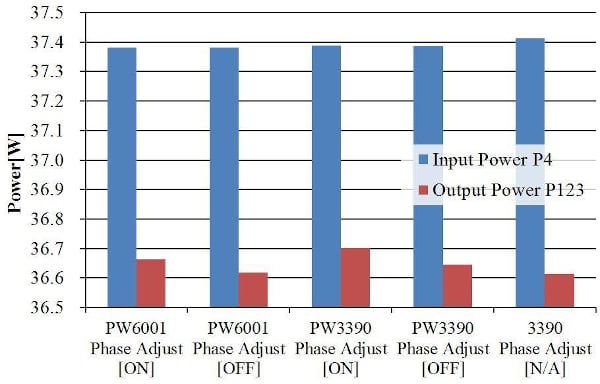
Figure 10: Comparison of inverter input and output power by model
Finally, a comparison of the loss values shown in Figure 9 reveals that loss values obtained from the PW6001 and PW3390 with phase correction enabled were 0.1 W (equivalent to 12%) lower than values from the 3390. This test measured a small motor as its load, but a 12% difference in loss for a 10 kW, 95% efficient inverter would be equivalent to 60 W of power, a difference large enough to have an impact on thermal design.
To accurately evaluate efficiency down to the 0.1% level and loss to the 1 W level in a high-efficiency motor drive system, it is important to ensure that the entire power measurement system has appropriate amplitude and phase characteristics. The authors’ measurement results illustrate the effectiveness of current sensor phase correction.
Because the measured inverter used a switching frequency of 20 kHz, both the PW6001 and PW3390 had an adequate frequency band, and there were no significant differences in the measurement results from the two instruments. However, differences between the two models are expected if the switching frequency increased further.
Conclusion
This paper focused on inverter output power, outlining the requirements for power measuring instruments in order to facilitate accurate measurement. It identified the importance of current sensor phase correction expertise in fulfilling those requirements and verified the effectiveness of that technique by comparing actual measurements. In the field of power electronics, there are numerous opportunities for measuring power at high frequencies and low power factors3) apart from motor drive systems, and phase correction expertise can be effectively utilized in those applications. We look forward to providing more useful information about this topic to readers in the future.
About the Authors
Hideharu Kondo, Chiaki Yamaura, Yukiya Saito and Hiroki Kobayashi works at Hioki E.E. Corporation, a Japanese Electrical Measuring Equipment developer and manufacturer based in Ueda, City, Nagano Prefecture. The company was first established in June 1935, and registered as Hioki E.E. on January 5th, 1952.
References
- Hayashi, K, “High-Precision Power Measurement of SiC Inverters,” Bodo’s Power Systems, September 2016, pp.42-47.
- Yoda, H, et al. ”Current Measurement Methods that Deliver High Precision Power Analysis in the Field of Power Electronics” Bodo’s Power Systems, April 2016,pp.38-42.
- Hayashi, K, “Measurement of Loss in High-Frequency Reactors,” Bodo’s Power Systems, February 2017, pp.18-22.
This article originally appeared in the Bodo’s Power Systems magazine.