Datalogging Platform for Junction Temperature Estimation and Converter Diagnostics
This article describes the validation of the technology and its use in a wide range of applications.
Accurate estimation of a power device’s junction temperature (Tj) is key to the design and reliable operation of a power converter. Amantys Power Electronics Ltd. has developed pioneering Tj Estimation technology, and has released an exciting new measurement platform – the Tj Estimation Evaluation System – aimed at laboratory and field testing, allowing simple evaluation in advance of large-scale industrial deployment. This article describes the validation of the technology and its use in a wide range of applications.
Introduction
Junction temperature (Tj) estimation is a key technology for “smart converters”. Improvements in converter current rating can be made – either by reducing margins or allowing dynamic changes in current rating – and operators can benefit from advanced warning of abnormal operation which is reflected in Tj and/or the electrical characteristics measured. These benefits of Tj Estimation become more important as converter power densities are increased and operating costs have to be reduced.
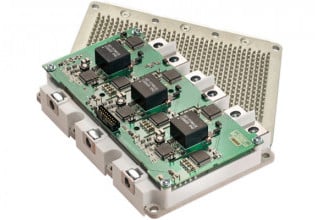
Amantys has developed a Tj Estimation Evaluation System, Figure 1, which allows converter OEMs and power stack designers to evaluate the Amantys Tj Estimation technology. It may be fitted to an inverter phase leg with a device rating up to 3300 V, and includes isolation, on-board processing and data-logging. It is ideal for laboratory validation of the Amantys technology. It acts as a data-logging tool that is independent from the converter controller, for example during type testing. It can also be used to diagnose problems in the field where oscilloscopes cannot easily be fitted and problems may be intermittent.
Figure 1: Amantys Tj Estimation Evaluation System
The system is now available for partners to test the accuracy of the measurements and explore the benefits of Tj estimation in their application.
What is Tj Estimation?
Junction temperature (Tj) estimation uses temperature sensitive electrical parameters (TSEPs) from the IGBT and diode, measured on the IGBT module, to estimate the on-chip junction temperature. The alternative technique of online junction temperature simulation requires a detailed thermal model and calculation of power losses in order to calculate Tj; this is the method used by some converter manufacturers, which struggles at low AC frequencies and does not track power module degradation. The advantage of Amantys’s technology is that the auto calibration algorithm means that a detailed thermal model is not required.
A comprehensive review of using changes in electrical behaviour in power devices for Tj estimation using TSEPs is given in [1]. The only TSEP that is universal to all power devices, to all converter switching patterns (including solid-state switches) and to all gate drive methods is the ON-state voltage drop. This allows the technology to be developed for any converter application, and requires accurate measurement of both the ON-state current and ON-state (forward) voltage drop. While using TSEPs measurable using the gate voltage – e.g. internal gate resistance [2] or MOS gate threshold voltage – may seem attractive, these cannot be used for the diode and require invasive access to the gate drive, so are unsuitable for a large range of applications.
Measurements
The Evaluation System has been designed to measure accurately the ON-state voltage drop of both switches in a half-bridge leg. The IGBT and freewheel diode forward voltages are measured as positive and negative voltage drops respectively. Measurements are also made of the DC link voltage, phase current, PWM timings and external module temperature.
The Evaluation System can measure both an internal module NTC thermistor or an external temperature sensor (NTC or PTC thermistor, or PT1000 sensor), giving compatibility with a wide range of module types. Measurements are recorded at a sample rate of 1 ms, with signals aggregated within each sample period.
The current can be measured using a Hall-effect sensor, in one of two ways:
(a) using the existing converter phase current sensor and feeding the signal through the Evaluation System, or
(b) adding an extra current sensor. Rogowski sensors are not suitable because they cannot measure DC or low-frequency AC currents.
Figure 2 shows examples of measurement waveforms taken from a back-to-back test rig, using an open half-bridge module rated at 1700 V/600 A and operating at 500 V. This demonstrates the high quality of the ON-state voltage measurements. Plotting the ON-state voltage and current on a scatter plot for a whole mission profile (Figure 3) show further evidence of the measurement quality: without accurate ON-state measurements this data visualization would be difficult.
Figure 2: Example of VCE(on) and IC(on) measurement waveforms recorded at a DC supply of 500 V. (IC(on) is relative to the device rated current.)
Figure 3: Example of IGBT I-V scatter plot; colour represents module NTC thermistor temperature (°C) and IC(on) is relative to the device rated current.
Tj Auto-Calibration
Using any electrical device measurements to estimate Tj relies on accurate calibration. This is necessary because of the wide variation in electrical characteristics between production batches [3]: an error of only 10 mV can easily cause up to 10 °C error in the estimated temperature. In a laboratory environment this may be achieved using a curve tracer, but this is time-consuming and completely impractical for industrial applications. In multi-chip modules, the voltage drop measured between the collector and emitter sense terminals includes bond wires which can degrade, so ultimately TSEPs must be tracked continuously to keep the estimated Tj accurate. Modifying the converter topology to achieve this, e.g. [4], would be expensive and impractical.
With a goal of simplifying the calibration process, Amantys has developed a unique algorithm for auto-calibration of TSEPs. This runs on the Evaluation System, which takes all necessary measurements to achieve this. It requires only a simple mission profile, of up to 5 minutes long, e.g. Figure 4, which is run on the whole converter. It simply requires an inductive load – i.e. zero power factor – and sufficient baseline (heatsink) temperature variation, which can be achieved if required by reducing the coolant flow or fan speed. In this way it is completely compatible with a typical end of line test after production. Further work is also under way to allow re-calibration online (during converter operation).
Figure 4: Calibration mission profile; peak current Ipk is relative to the device rated current.
Examples of the auto-calibration algorithm working are shown in Figures 5(a)-(d), with estimated temperature compared with the measured (actual) temperature. The actual temperature was measured using pyrometric infrared temperature sensors, with one placed above each chip in the module (3 chips per device). These have a relatively slow response time. The estimated temperature is calculated every millisecond from the calibrated TSEPs and the ON-state voltage measurements; however for the comparison here it is filtered to match the response of the infrared sensors.
The mission profile, applied to the back-to-back test rig as previously described, consists of four 5-minute sections: calibration, random load at zero power factor, automotive operation (based on the FTP-75 urban driving cycle), and a slower more regular operation.
The initial mismatch of temperature in Figure 5(a) is because the TSEPs are initially set using the datasheet I-V curves: this highlights the need for accurate calibration. After calibration, the estimated and actual temperatures differ by up to only 2 °C, with an rms temperature error of 1.3 °C for the remainder of the mission profile. The estimated temperature matches the actual temperature at low frequencies – both for the peak and mean Tj – and during high-current sections of the automotive driving cycle, see Figures 5(b)-(d). The rms temperature error for the diode is similar, at 1.4 °C.
Data-logging
In addition to being a platform for evaluating Tj Estimation, the Evaluation System is a comprehensive data-logging system. All measurements are recorded in text (.csv) files at a 1 ms rate; these are stored on up to 4 USB memory sticks. The data rate is approximately 11 GB/day, giving up to about half a year’s worth of data using 4 x 512 GB USB drives. All measurements may also be streamed over Ethernet (using SCPI); this allows real-time access to the data, e.g. from the converter controller.
Figure 5: Validation of estimated IGBT Tj. From top to bottom: (a) whole mission profile, including calibration cycle 0 to 300 s, (b) random load at pf = 0 and low frequency (1 Hz), (c) & (d) sections of automotive mission profile.
Visualisation and PC Lab Tool
To assist with operating the Evaluation System in a laboratory environment, Amantys has developed a PC application to allow live monitoring of the measurements and estimated Tj over Ethernet. This has been specifically developed to monitor both short-duration signals (e.g. ON-state voltage and current waveforms) and long-duration signals (e.g. rms or peak current and temperatures). IV scatter plots are also provided, allowing users to visualize ON-state behaviour and check data quality, whether Tj Estimation is being used or not. Figure 6 shows typical operation of the PC software.
Application to Condition Monitoring
Condition monitoring of power semiconductor devices is enabled in two ways using the Amantys Tj Estimation technology. Firstly, data-logging over many months allows measurements to be analysed offline (not in the converter). Secondly, aspects of the auto-calibration algorithm can be used to detect when TSEPs start to change, high-lighting changes in the electrical or thermal system which are early indicators of wear-out or abnormal behaviour.
Figure 6: PC software used to operate the Evaluation System
Integration into Converters
While the Evaluation System may be used to test the Amantys Tj Estimation technology in the laboratory, it is not designed for integration into a production converter. The Tj Estimation algorithm may be implemented in the converter controller, or in an inverter stack control card, since these have access to all measurements required. Amantys is working on a portfolio of options to ease the integration of the technology into a production converter.
For pure condition monitoring or retrofit applications, it may be possible to design a more compact version of the system to allow integration into the target converter.
Conclusions
The Tj Estimation Evaluation System offers a flexible and sophisticated platform for evaluating the Amantys Tj Estimation technology and for performing converter diagnostics. The cornerstone of this technology is the accurate VCE(on) measurement, combined with the auto-calibration algorithm that Amantys has developed to simplify the TSEP calibration process significantly. For the first time, truly general-purpose Tj Estimation technology is available for evaluation, applicable to a wide range of devices, modules and converters.
About the Author
Angus Bryant holds a Ph.D. in Power Electronics and a Master's Degree in Electronics Engineering both at the University of Cambridge. He specializes in power semiconductors, multilevel converters and high power IGBTs. He currently works as the System Architect at Amantys Ltd. since May 2014.
References
- N. Baker et al, IEEE Industrial Electronics Magazine, pp. 17-27, Sep 2014
- M. Denk et al, PCIM Conference Proceedings, pp. 818-825, May 2015.
- U. Scheuermann, PCIM Conference Proceedings, pp. 691-697, May 2016
- B. Ji et al, IEEE Trans. Power Electronics, vol. 30, no. 3, March 2015.
This. article originally appeared in the Bodo’s Power Systems magazine.


